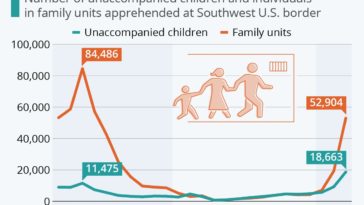
in Infographics Chart : The number of children detained at the US Southern Border is rising for the first time in more than a year
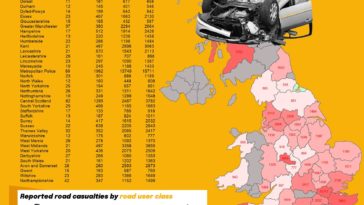
in Infographics Chart : Personal injury accident and casualty statistics on public roads in Great Britain for the year ending June 2020
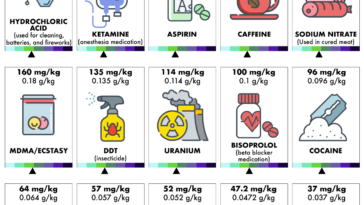
in Infographics Chart : The lethal dose of 55 substances (how much of substances like water and sugar would it take to be lethal?)
in Infographics Chart : Kyoto’s trend of earlier flowering Cherry Blossoms is another sign of Man-Made Climate Change
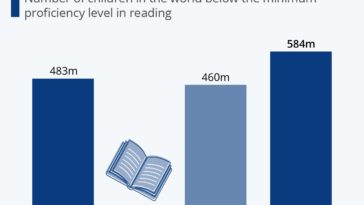
in Infographics Chart : Despite continued online schooling, the pandemic caused a rise in child reading difficulties
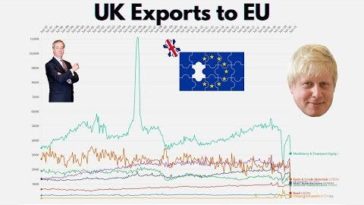
in Infographics Chart : United Kingdom’s Export to the European Union since January 1997. Exports to EU plunged by 40% in first month since Brexit.