in Infographics Data Chart : 50 Shades Of Sugar [Infographic March 9, 2019, 5:30 am 13.7k Views 0 Comments Data Chart : 50 Shades Of Sugar [Infographic ICYMI: 50 Shades Of Sugar Sharing is caring, don’t forget to share this infographic ! 0 shares What do you think? 459 Points Upvote Downvote Leave a Reply Cancel replyYour email address will not be published. Required fields are marked *Comment * Name * Email * Website Next post
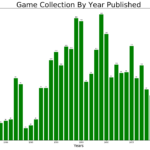
data visualization : I collect retro games and recently hit 3000 titles! Decided to chart the games by year published to see what the distribution looked like. [OC]