in Infographics Data Chart : 50 Shades Of Sugar [Infographic March 10, 2019, 8:15 pm 13.7k Views 0 Comments Data Chart : 50 Shades Of Sugar [Infographic 50 Shades Of Sugar Sharing is caring, don’t forget to share this infographic ! 0 shares What do you think? 459 Points Upvote Downvote Leave a Reply Cancel replyYour email address will not be published. Required fields are marked *Comment * Name * Email * Website Next post
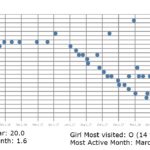
data visualization : [OC] I’ve been seeing prostitutes for a few years. Here’s my encounters with them from 2015 until today.