in Infographics Data Chart : Facebook’s Master Plan And What It Means For You [Infographic February 2, 2019, 9:28 pm 22.9k Views 0 Comments Data Chart : Facebook’s Master Plan And What It Means For You [Infographic Infogrpahic about Facebook`s 10 year master plan and how far they have come Sharing is caring, don’t forget to share this infographic ! 0 shares What do you think? 459 Points Upvote Downvote Leave a Reply Cancel replyYour email address will not be published. Required fields are marked *Comment * Name * Email * Website Next post
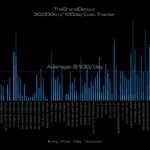
data visualization : I Left My Job for 100 Days on a 30,000km Roadtrip – This is How Much I Spent (More Data and Charts in the comments) [OC]