in Infographics Data Chart : The Cost of Being Iron Man [infographic] February 14, 2019, 8:52 am 17.2k Views 0 Comments Data Chart : The Cost of Being Iron Man [infographic] The Cost of Being Iron Man [infographic] Sharing is caring, don’t forget to share this infographic ! 0 shares What do you think? 459 Points Upvote Downvote Leave a Reply Cancel replyYour email address will not be published. Required fields are marked *Comment * Name * Email * Website Next post
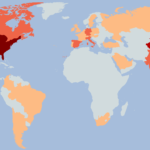
data visualization : Number of “Alpha cities” in each country according to Globalization and World Cities Research Network 2018 [OC]