in

Data Chart : The Dangerous Side Of Biking [Infographic

Data Chart : The Dangerous Side Of Biking [Infographic

Biking is one of the most popular activities worldwide. In fact, in some countries it has become the main vehicle of transportation, surpassing cars and even the subway.
  • Sharing is caring, don’t forget to share this infographic !

  • What do you think?

    459 points
    Upvote Downvote

    Leave a Reply

    Your email address will not be published. Required fields are marked *

    Loading…

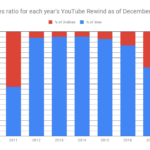
    data visualization : The percentage of likes to dislikes for each year’s YouTube Rewind. [OC]

    Video Infographic : InfoGraphic Tutorial in Photoshop #05 – Circle Pie Chart