in Infographics Data Chart : This Infographic on How Much Wildlife We’ve Lost in the Past 40 Years Will Shock You January 31, 2019, 2:07 am 14.9k Views 0 Comments Data Chart : This Infographic on How Much Wildlife We’ve Lost in the Past 40 Years Will Shock You This Infographic on How Much Wildlife We've Lost in the Past 40 Years Will Shock You Sharing is caring, don’t forget to share this infographic ! 0 shares What do you think? 459 Points Upvote Downvote Leave a Reply Cancel replyYour email address will not be published. Required fields are marked *Comment * Name * Email * Website Next post
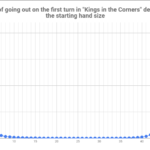
data visualization : [OC] The Odds of going out on the first turn in “Kings in the Corners” depending on the starting hand size (10,000 trials per hand size)