in Infographics Data Chart : Trade The VIX Like A Boss [Infographic March 12, 2019, 5:49 am 17.2k Views 0 Comments Data Chart : Trade The VIX Like A Boss [Infographic Trade The VIX Like A Boss Sharing is caring, don’t forget to share this infographic ! 0 shares What do you think? 459 Points Upvote Downvote Leave a Reply Cancel replyYour email address will not be published. Required fields are marked *Comment * Name * Email * Website Next post
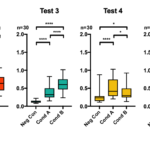
data visualization : [OC] I have lots of small individual ANOVA comparisons that I am analyzing for broad trends. How can I display my data without it being overwhelming?
Map : Idk if this counts, but this is what all the terrestrial planets would look like if they were terraformed