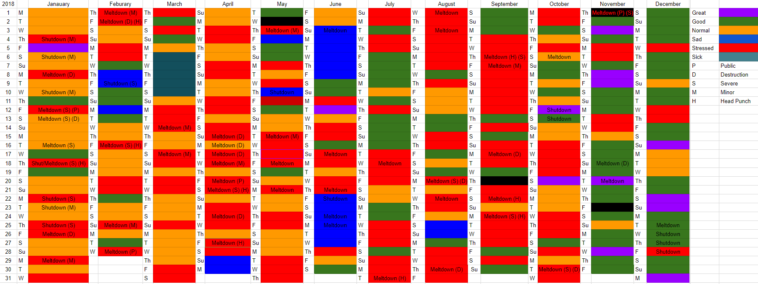
Data visualization : 1 year of Graduate School with Autism (A visual display of moods, meltdowns and more) [OC]
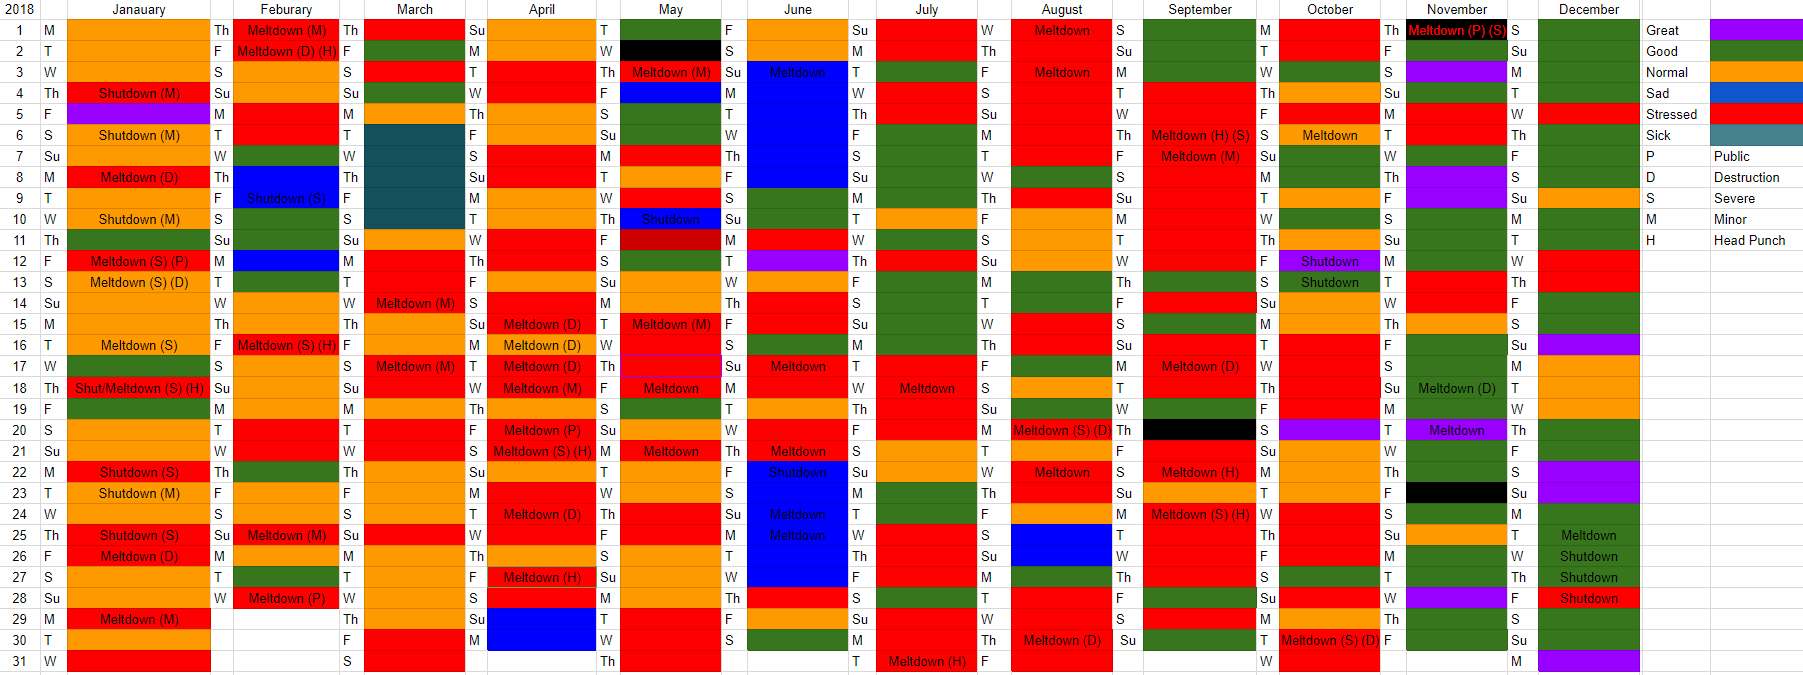
1 year of Graduate School with Autism (A visual display of moods, meltdowns and more) [OC]
By DesMephisto
At infographic.tv we provide handpicked collection of the best infographics and data charts from around the world.