Data visualization : Bell curve of the times of my 3,495 Rubik’s cube solves, plotted by frequency of each second mark [OC]
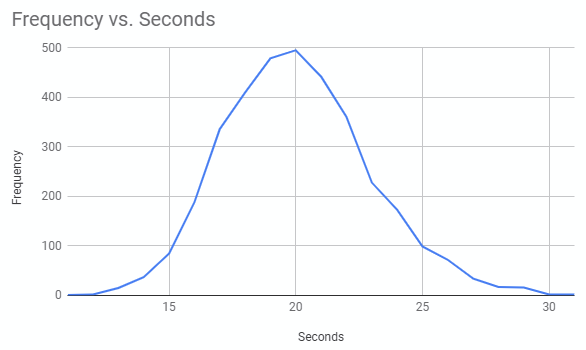
Bell curve of the times of my 3,495 Rubik’s cube solves, plotted by frequency of each second mark [OC]
By oi_peiD
At infographic.tv we provide handpicked collection of the best infographics and data charts from around the world.