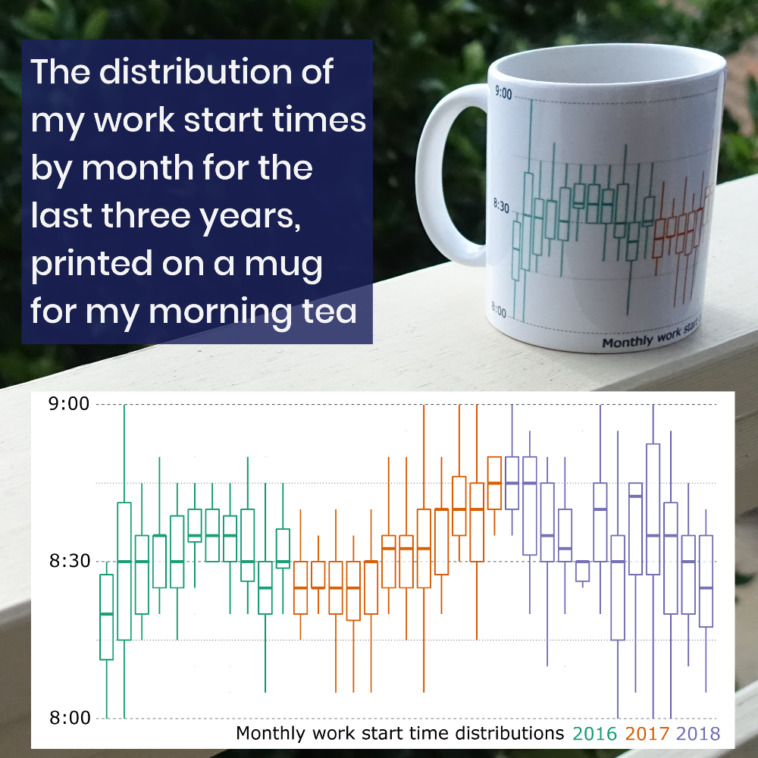
Data visualization : Boxplot of the times I started work for the last three years, by month, and printed on a mug [OC]
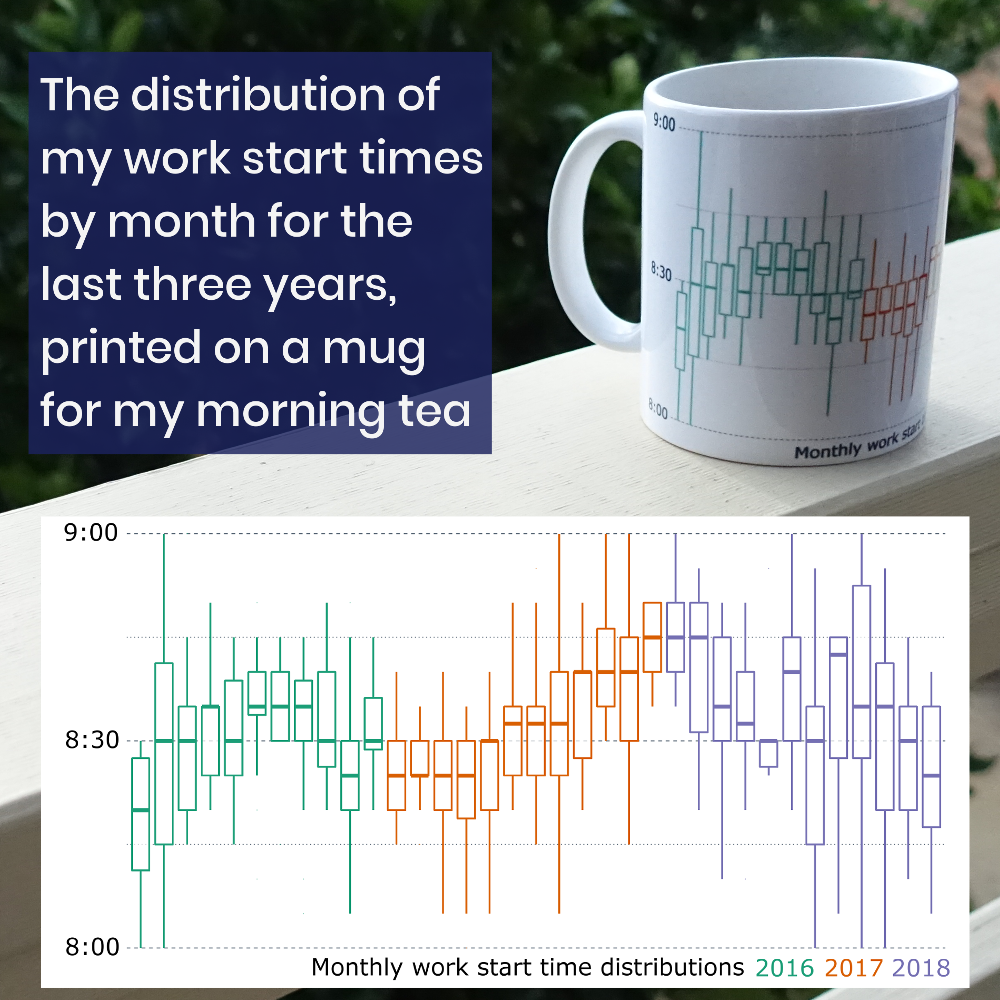
Boxplot of the times I started work for the last three years, by month, and printed on a mug [OC]
By DataIsBoring
At infographic.tv we provide handpicked collection of the best infographics and data charts from around the world.