Data visualization : College Football Betting Over/Under vs. Actual Points Scored in 2018 [OC]
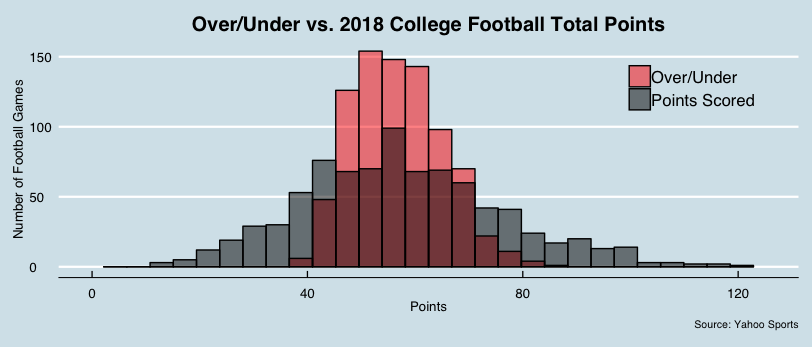
College Football Betting Over/Under vs. Actual Points Scored in 2018 [OC]
By Vegas_Muscle
At infographic.tv we provide handpicked collection of the best infographics and data charts from around the world.