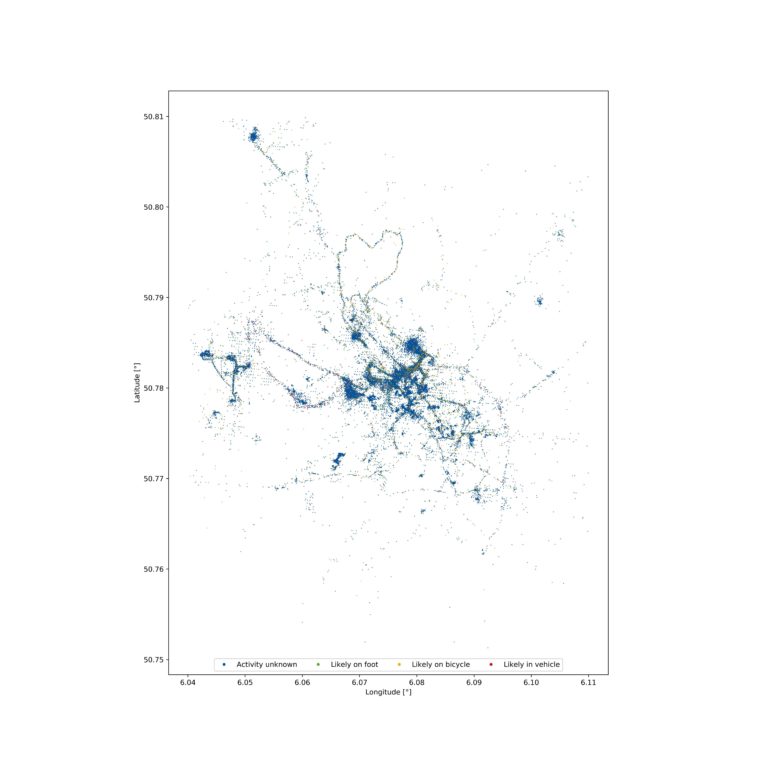
Data visualization : Created a map of the city where I study based on more than five years of Googles location history data [OC]
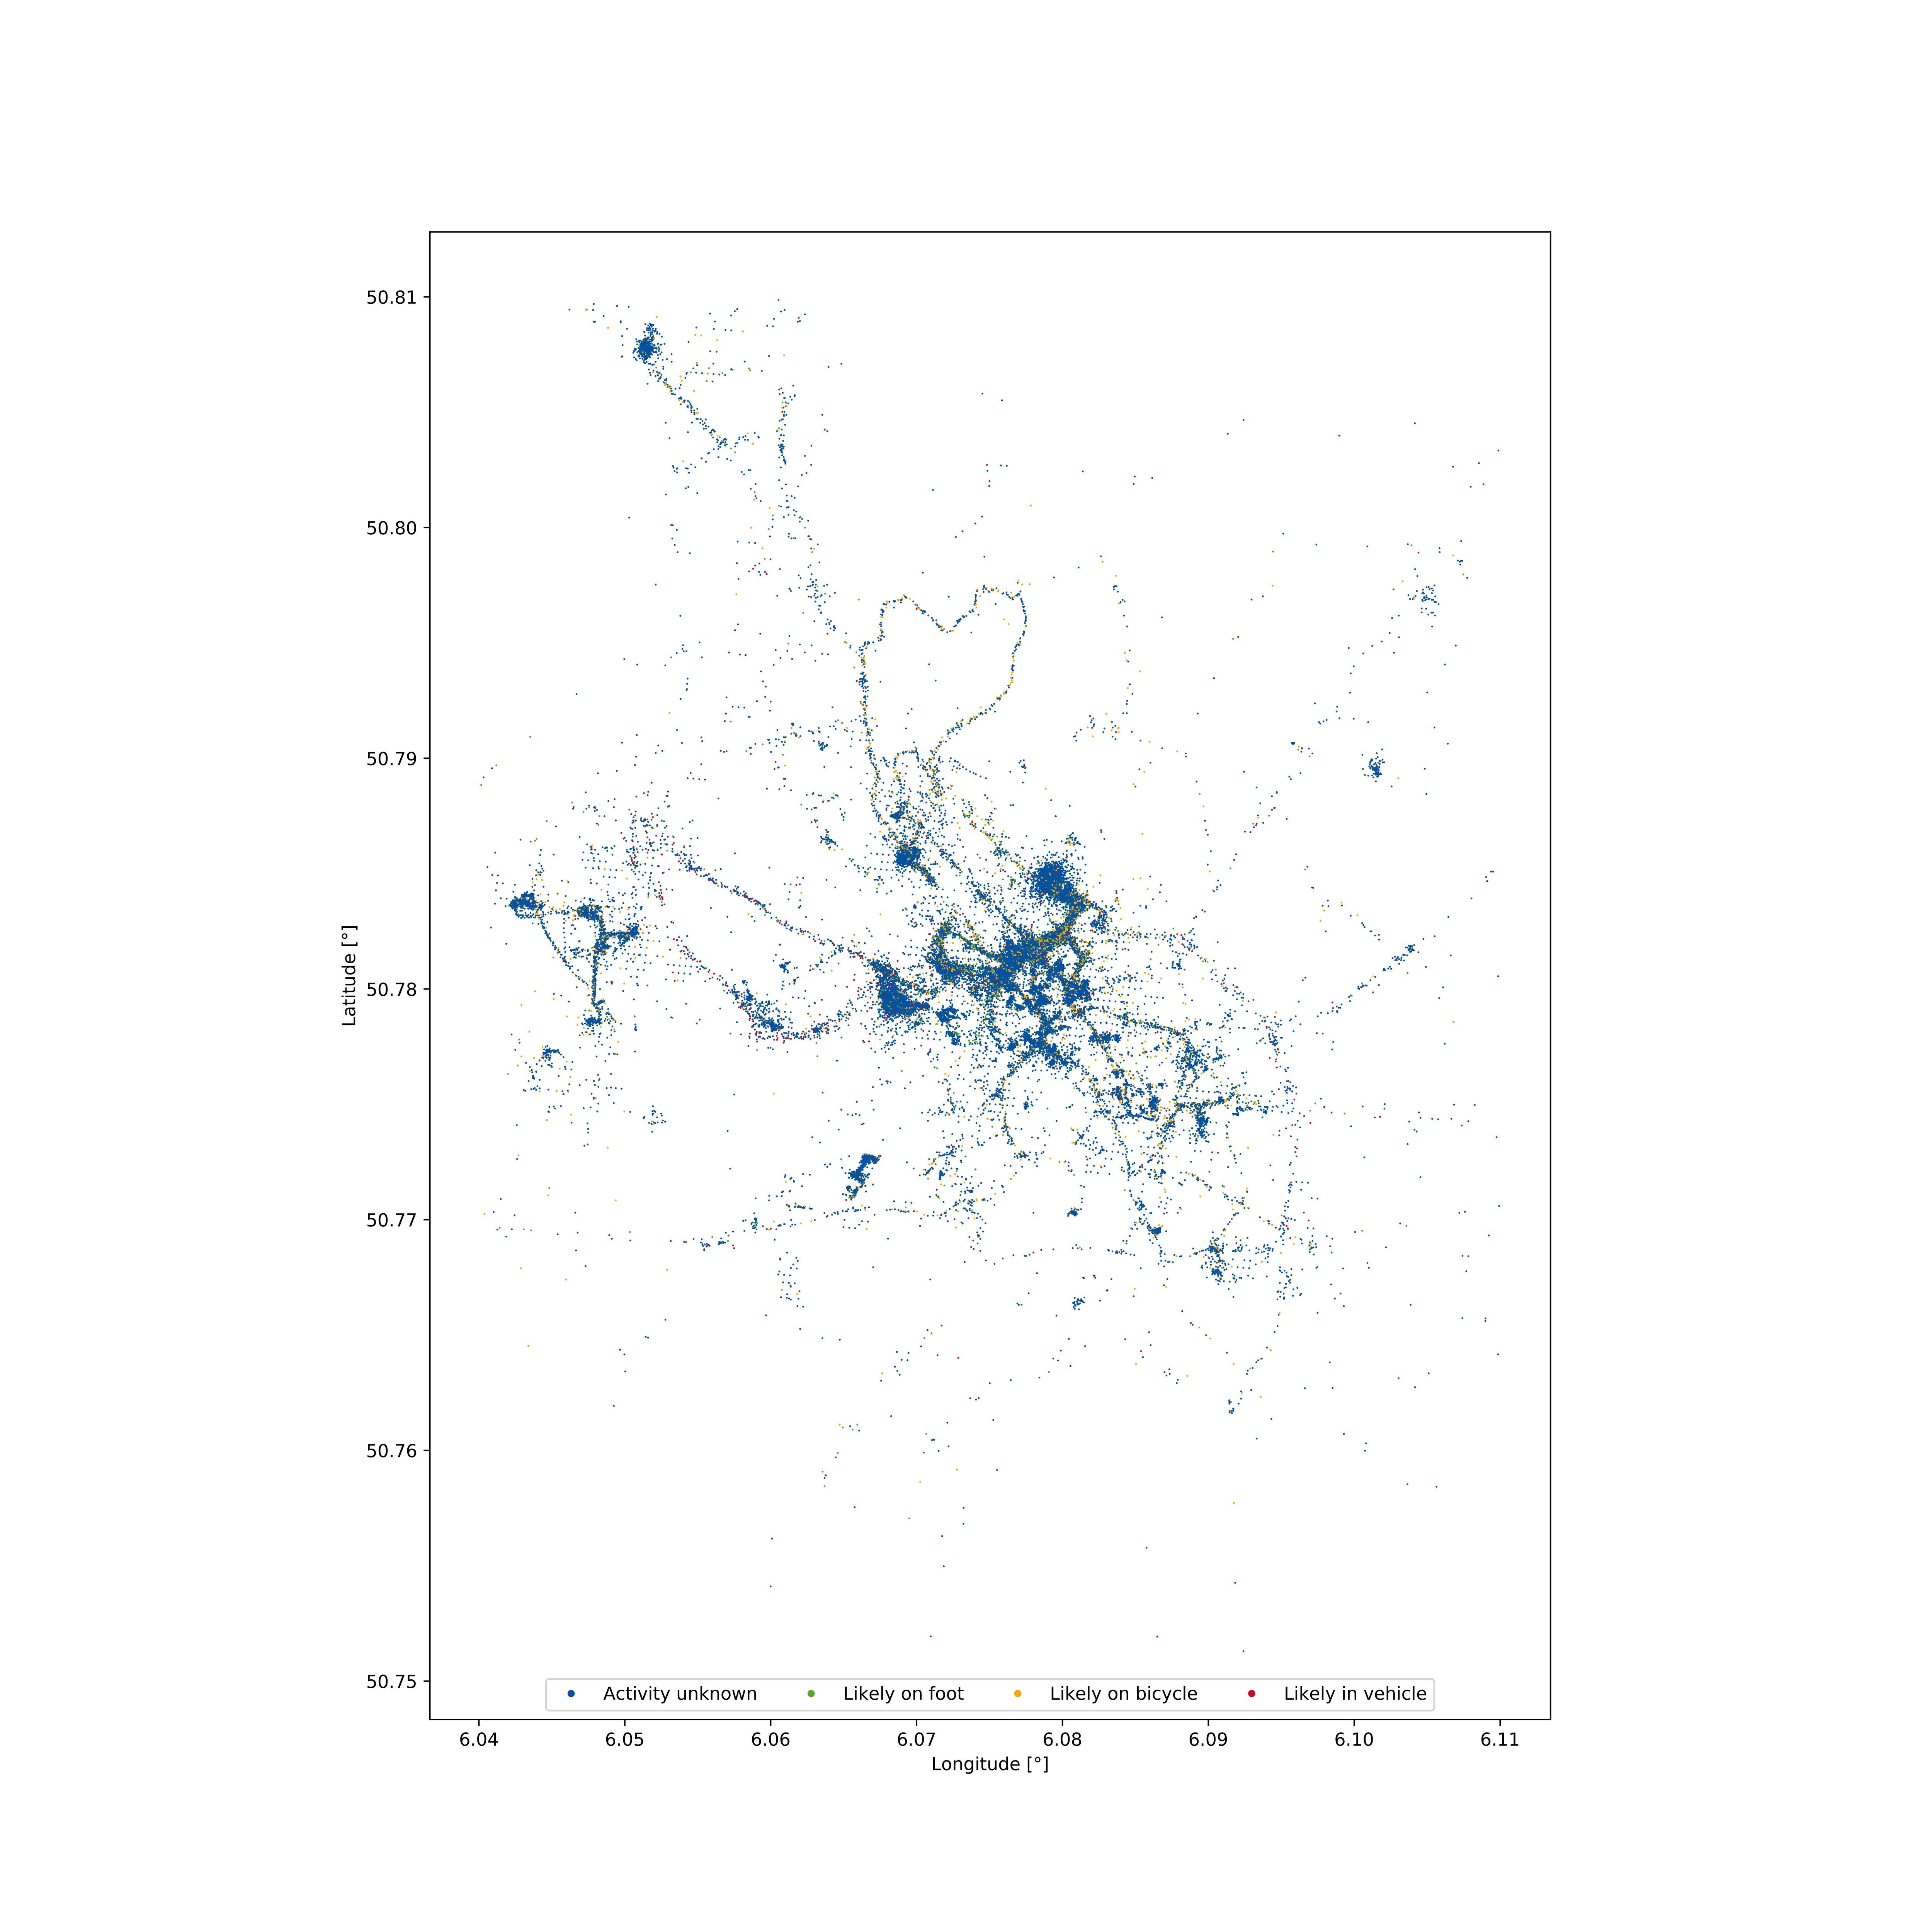
Created a map of the city where I study based on more than five years of Googles location history data [OC]
By Papier101
At infographic.tv we provide handpicked collection of the best infographics and data charts from around the world.