in

data visualization : Distributions of global anomalous temperatures over time [OC]

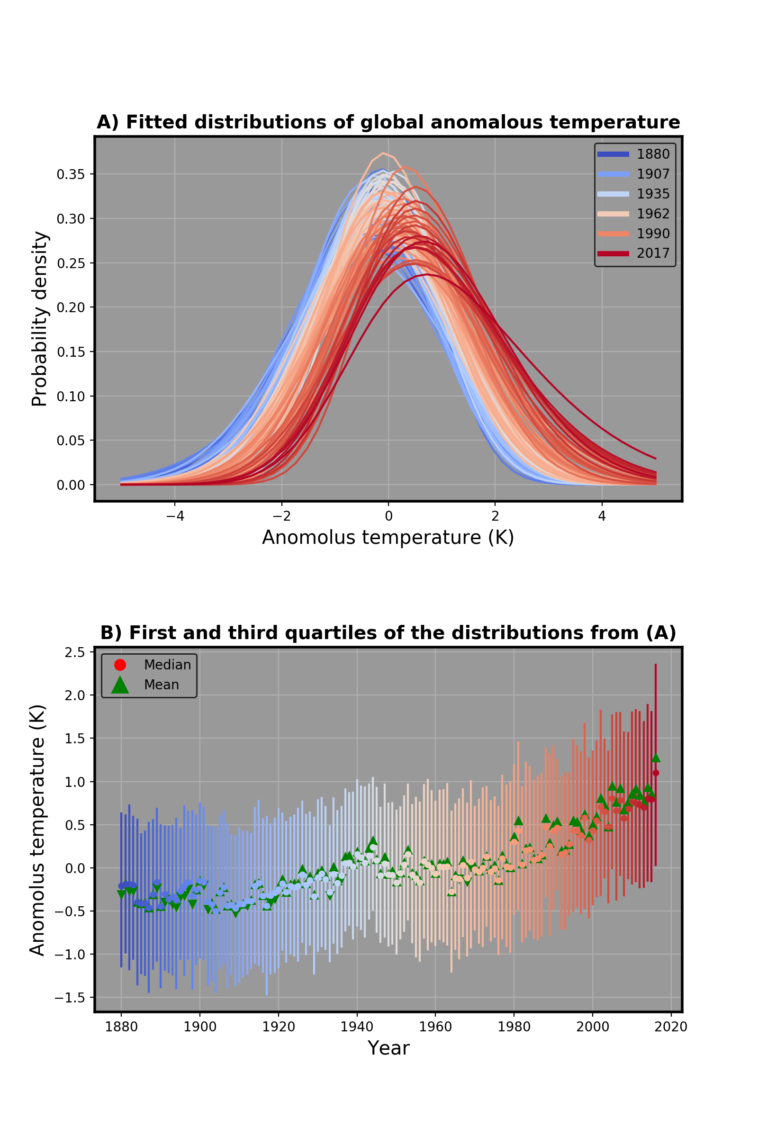
Data visualization : Distributions of global anomalous temperatures over time [OC]

Distributions of global anomalous temperatures over time [OC]

By EtanPooter

At infographic.tv we provide handpicked collection of the best infographics and data charts from around the world.

  • Don’t forget to share the love !
  • What do you think?

    460 points
    Upvote Downvote

    Leave a Reply

    Your email address will not be published. Required fields are marked *

    Loading…

    Infographic : Anatomy of a Formula 1 steering wheel

    Visual : NASA’s guide to air-filtering houseplants