Data visualization : For the first time, scientists have documented the transition of a stable, slow-moving landslide into a catastrophic collapse
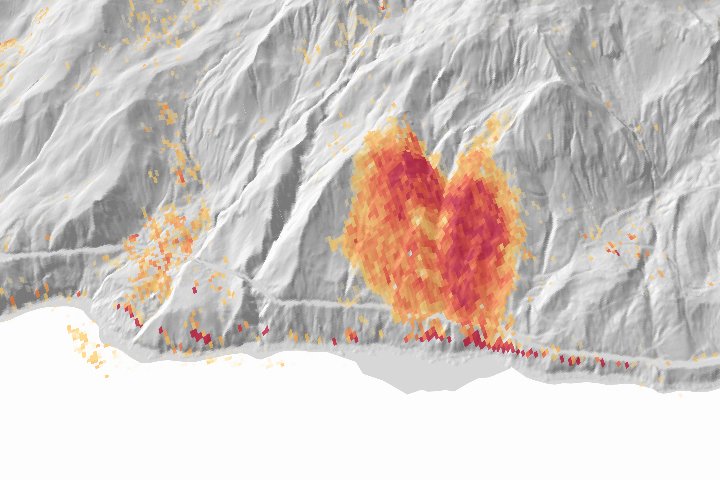
For the first time, scientists have documented the transition of a stable, slow-moving landslide into a catastrophic collapse
By Geographist
At infographic.tv we provide handpicked collection of the best infographics and data charts from around the world.