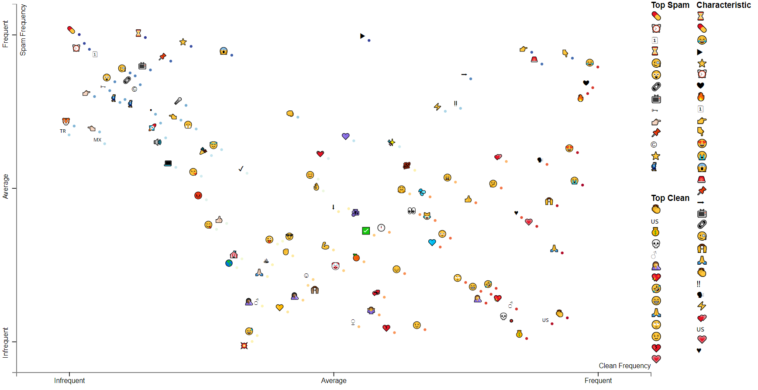
Data visualization : Frequency Distribution of Emoji usage on Twitter between spam and non-spam tweets [OC]
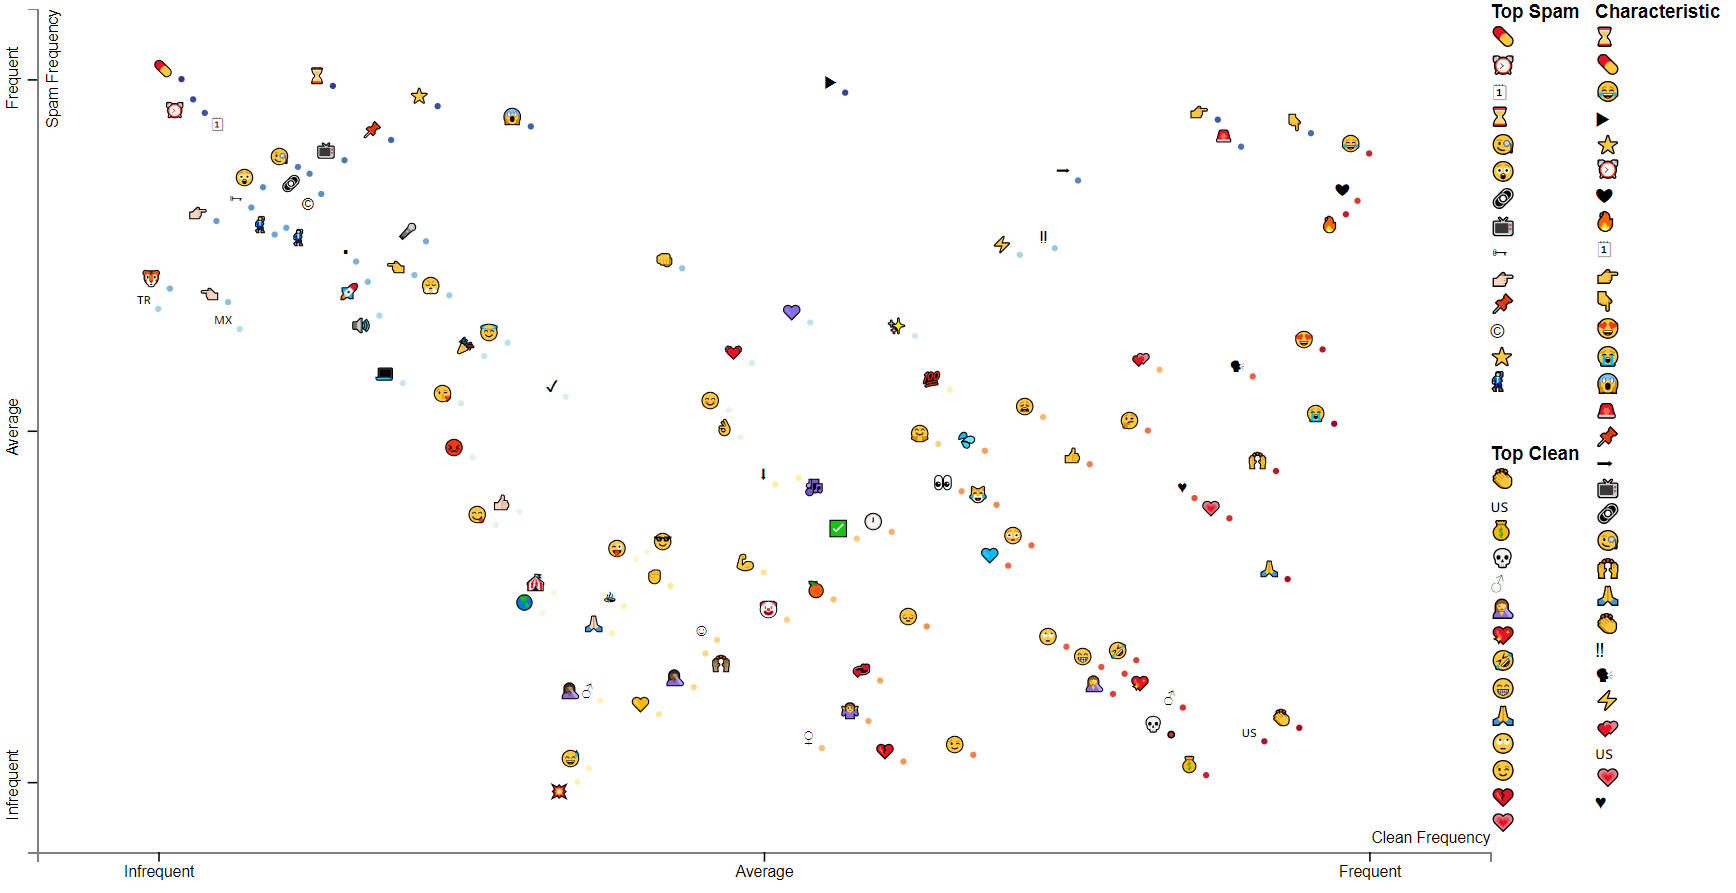
Frequency Distribution of Emoji usage on Twitter between spam and non-spam tweets [OC]
By artt_attack
At infographic.tv we provide handpicked collection of the best infographics and data charts from around the world.