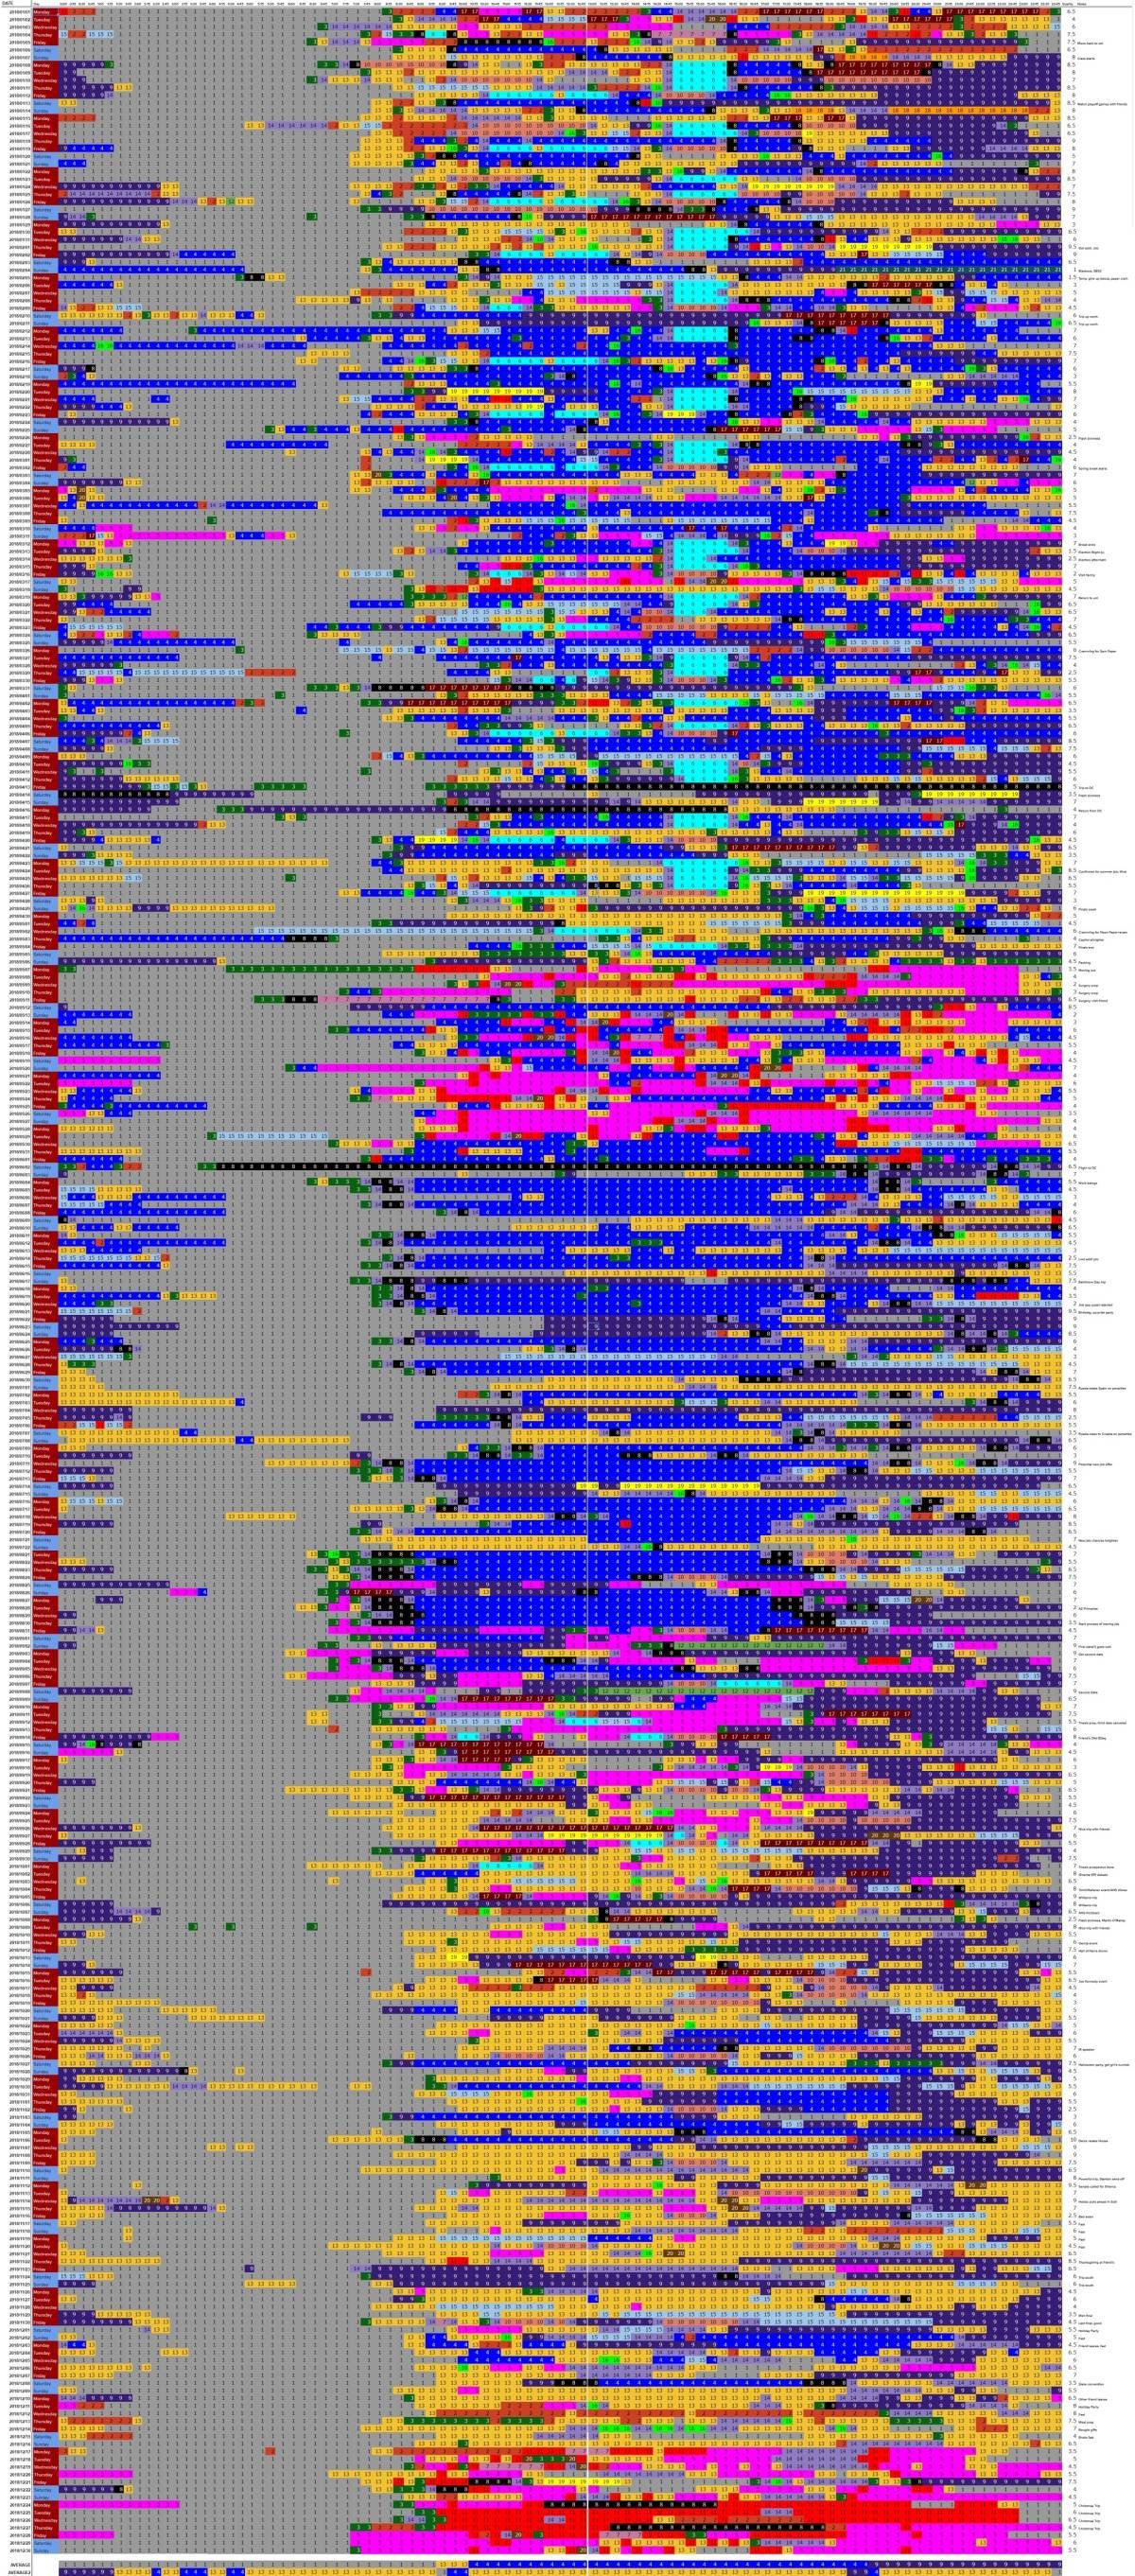
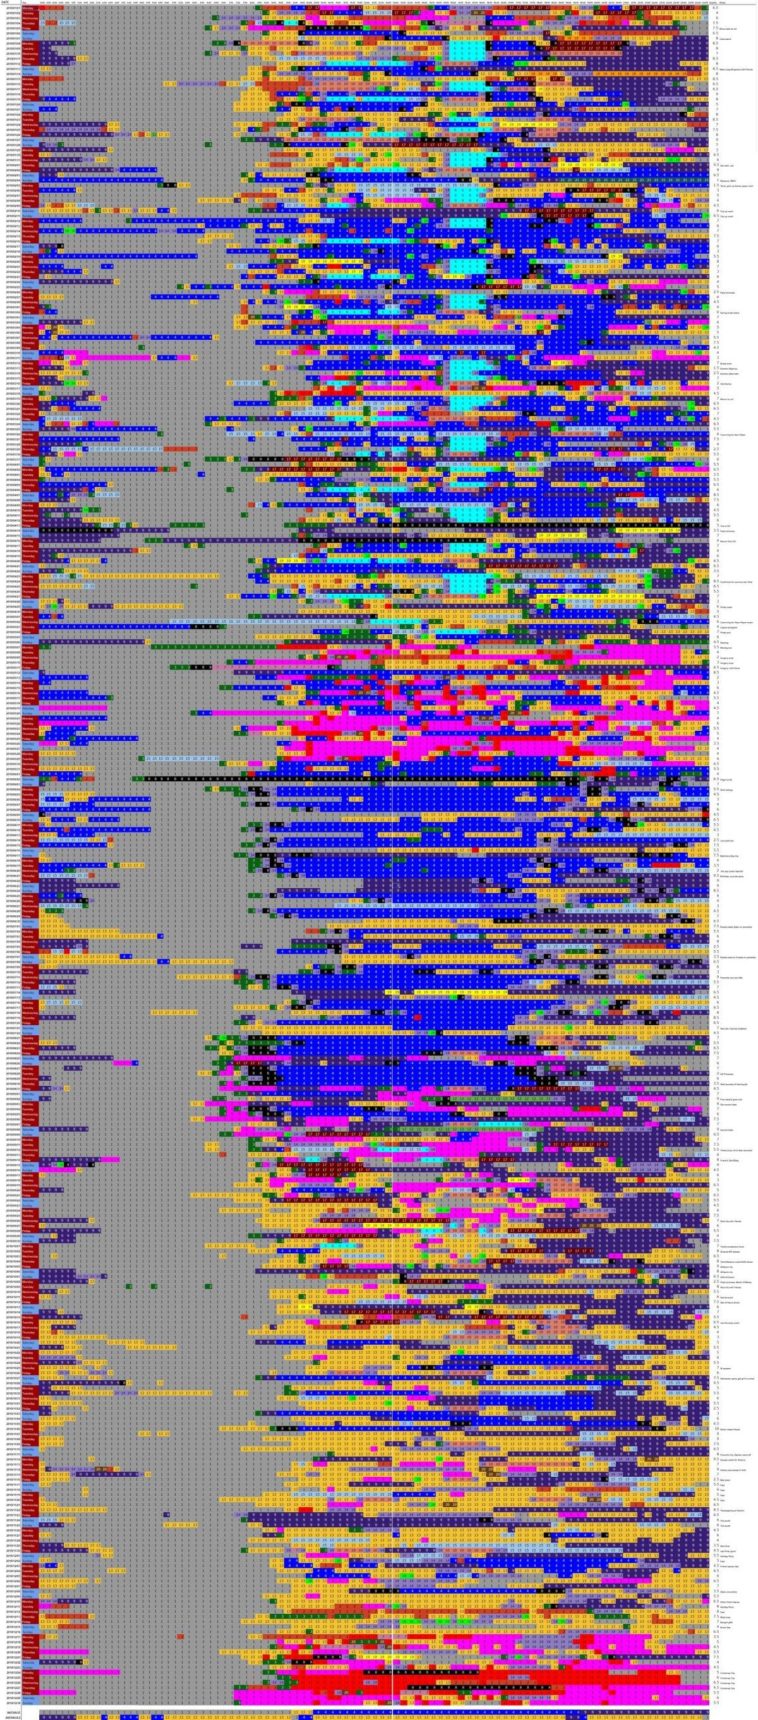
Data visualization : I recorded and cataloged every 15 minutes of my year so far (1/1/2018-12/30/2018). Graphs/template in comments! [OC]

I recorded and cataloged every 15 minutes of my year so far (1/1/2018-12/30/2018). Graphs/template in comments! [OC]
By hunter15991
At infographic.tv we provide handpicked collection of the best infographics and data charts from around the world.


