Data visualization : I recorded temperature during rain for 801 days in my city. Here are some charts I’ve made. [OC]
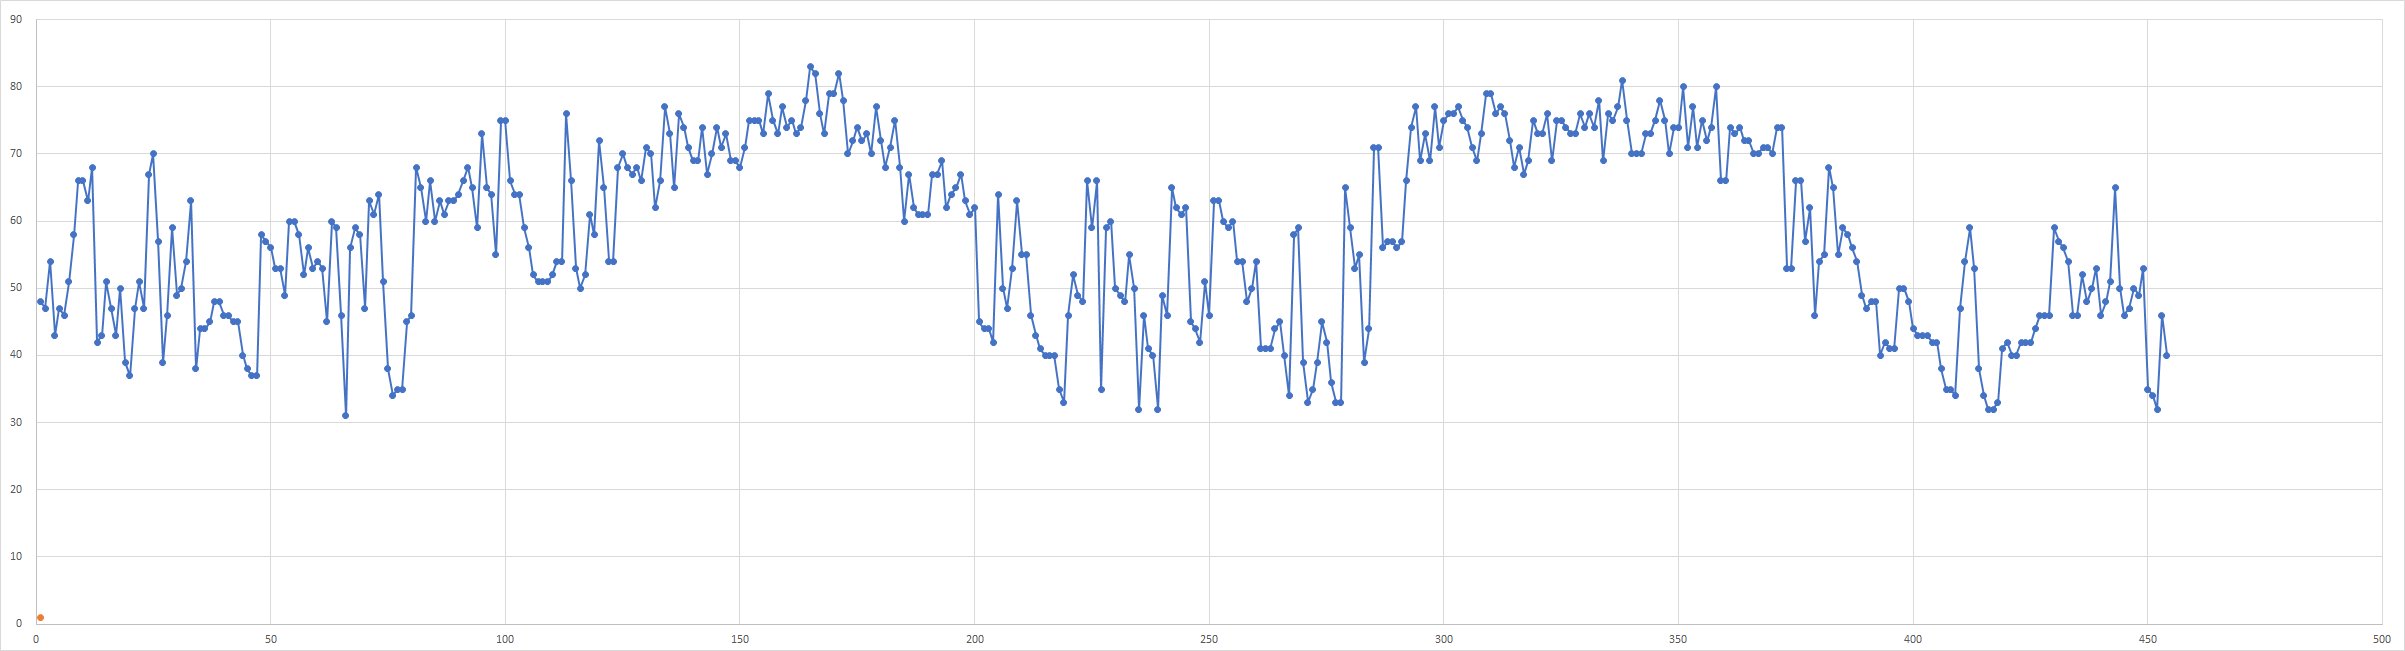
I recorded temperature during rain for 801 days in my city. Here are some charts I’ve made. [OC]
By TheJelloTello
At infographic.tv we provide handpicked collection of the best infographics and data charts from around the world.