Data visualization : I recorded the pressure when going under the Hudson River on the NJT Train, and it correlates to my ears popping.
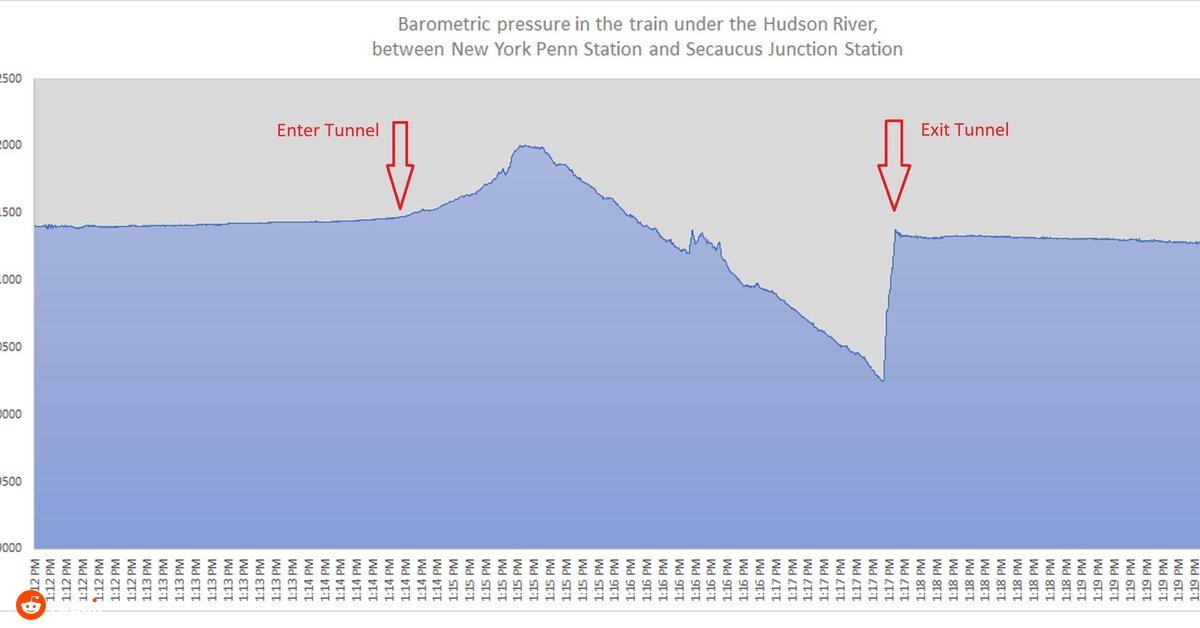
I recorded the pressure when going under the Hudson River on the NJT Train, and it correlates to my ears popping.
By NooJoisey
At infographic.tv we provide handpicked collection of the best infographics and data charts from around the world.