in

data visualization : Illustration of how razor thin supermarket profit margins are in the UK using Tesco Annual Financial Report. [OC] from Instagram @chartrdaily.
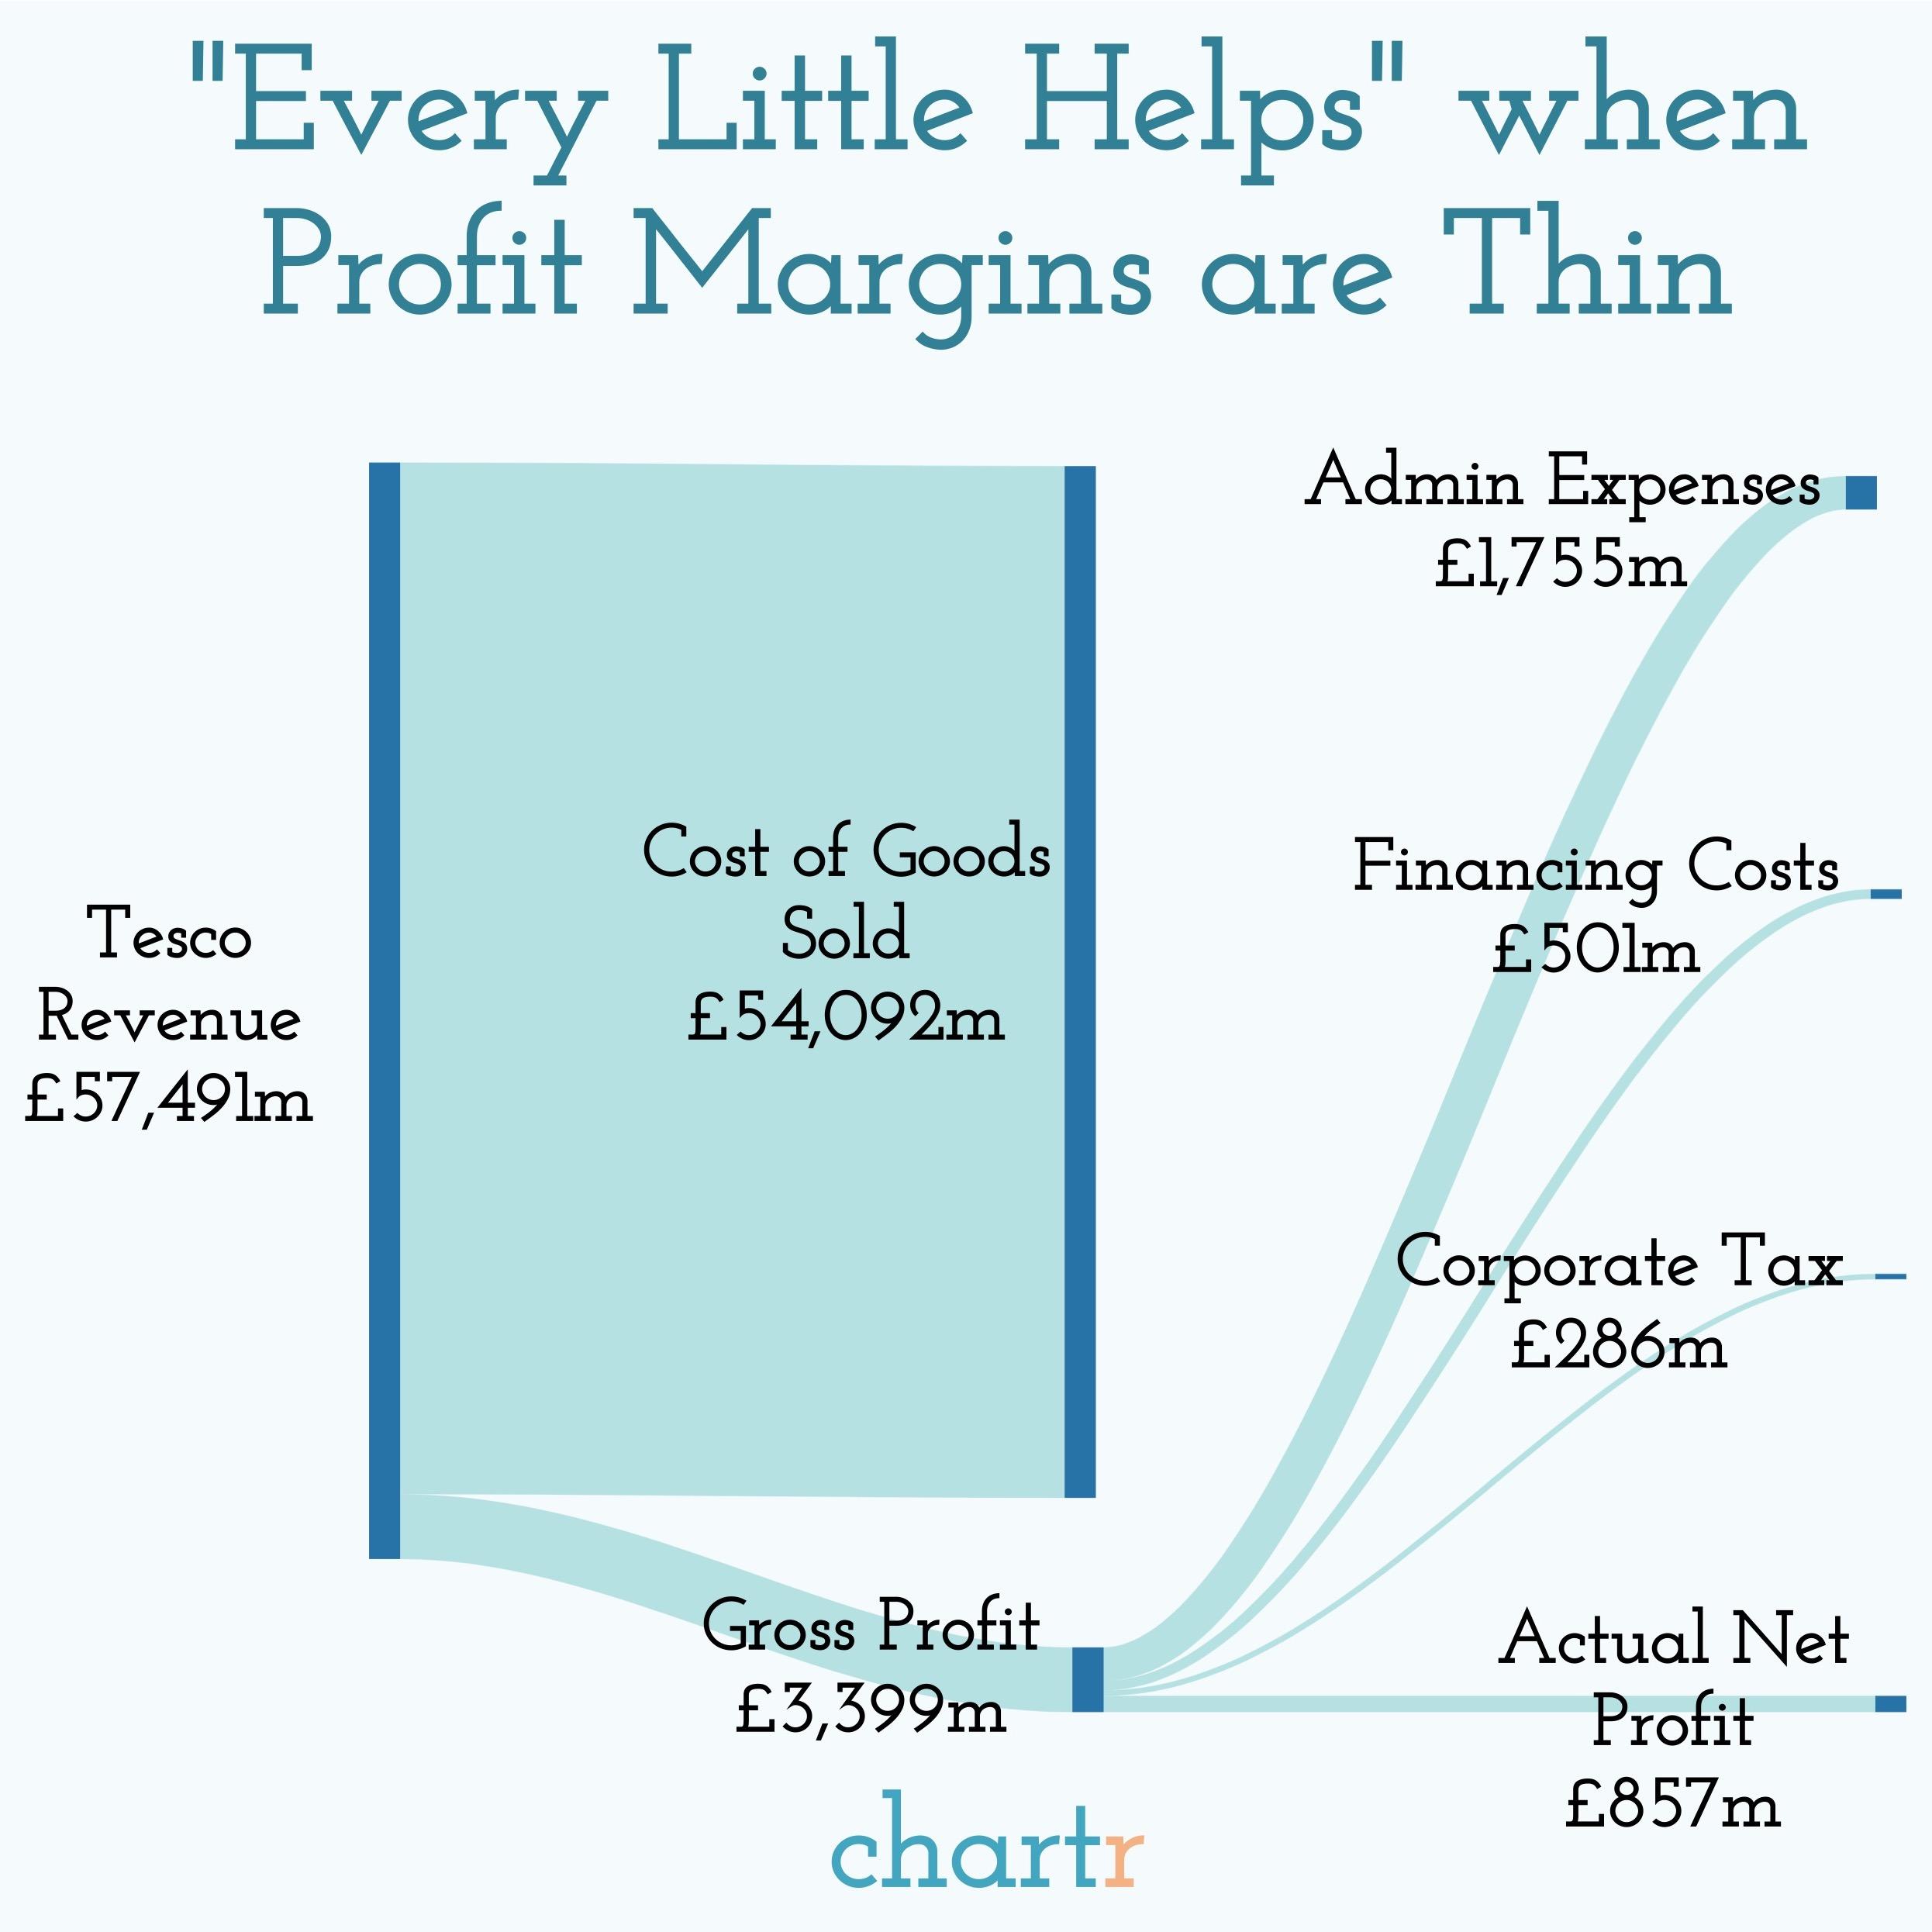
Data visualization : Illustration of how razor thin supermarket profit margins are in the UK using Tesco Annual Financial Report. [OC] from Instagram @chartrdaily.

Illustration of how razor thin supermarket profit margins are in the UK using Tesco Annual Financial Report. [OC] from Instagram @chartrdaily.

By chartr

At infographic.tv we provide handpicked collection of the best infographics and data charts from around the world.

  • Don’t forget to share the love !
  • What do you think?

    459 points
    Upvote Downvote

    Leave a Reply

    Your email address will not be published. Required fields are marked *

    Loading…

    Map : Scenic Walks and Places to see in Christchurch’s Central City, New Zealand

    Data Chart : Find out about the world’s most unsafe foods. If you ever come across them, you will not what to avoid #infographic #eatwithcaution