Data visualization : In 2018 I challenged myself to run a mile a day and narrowly succeeded [OC]
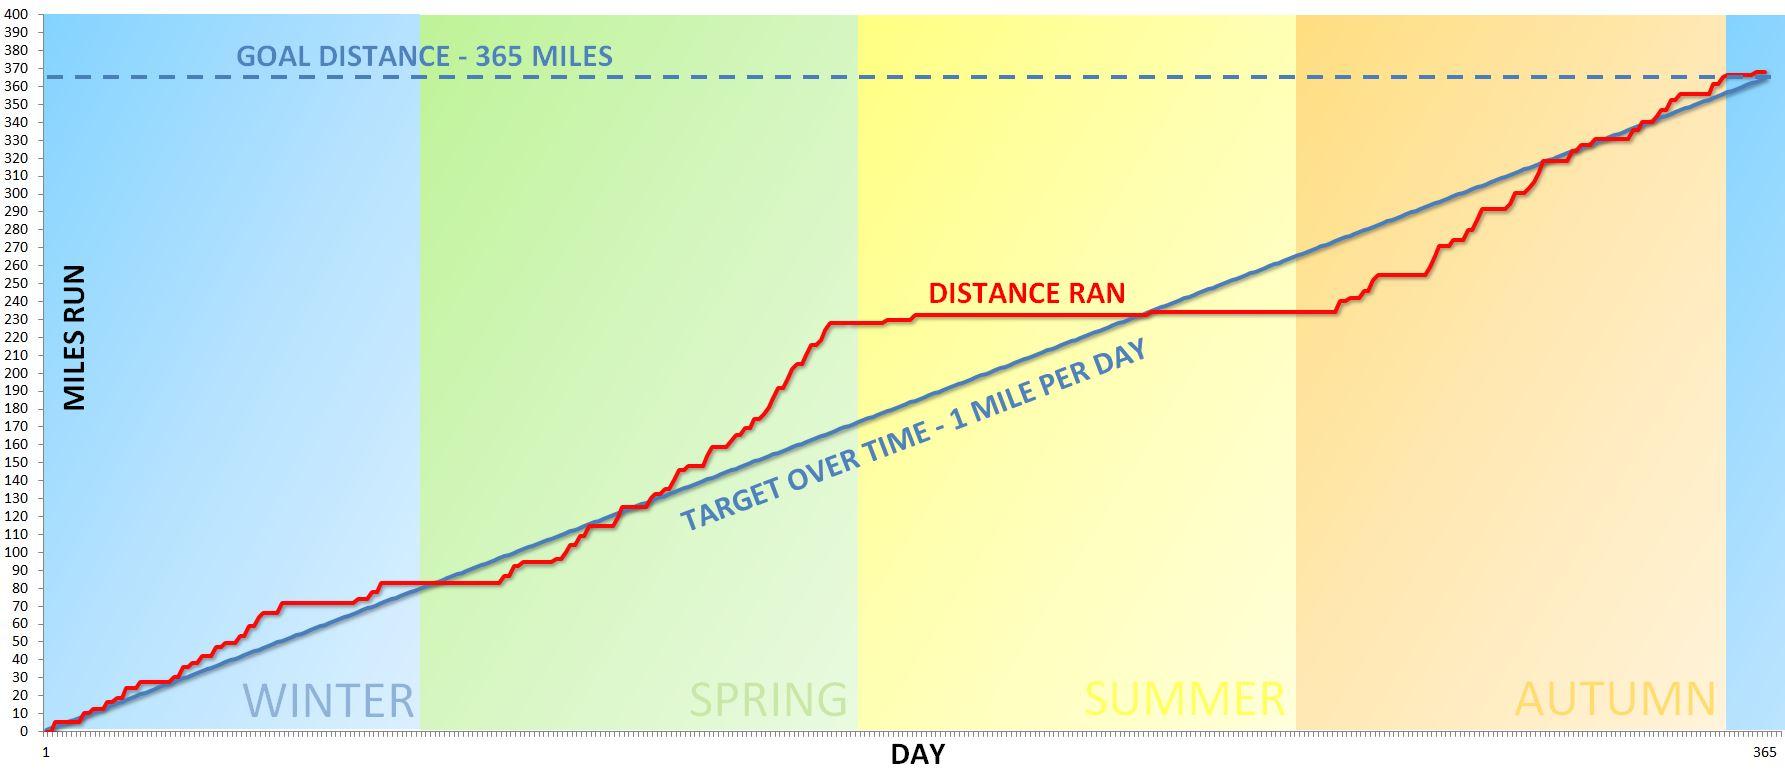
In 2018 I challenged myself to run a mile a day and narrowly succeeded [OC]
By CLBUK
At infographic.tv we provide handpicked collection of the best infographics and data charts from around the world.