Data visualization : Location and Spatial Density of Earthquakes with Magnitude >8 since 1500 C.E. [OC]
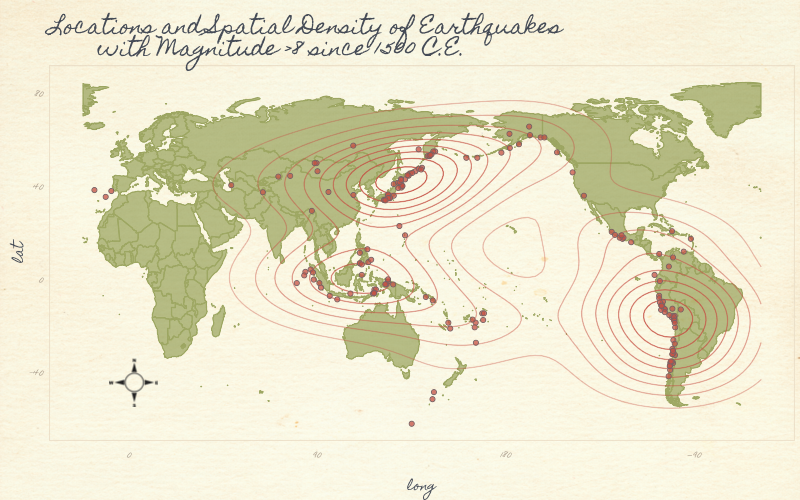
Location and Spatial Density of Earthquakes with Magnitude >8 since 1500 C.E. [OC]
By this_time_for_good
At infographic.tv we provide handpicked collection of the best infographics and data charts from around the world.