in

data visualization : Mapped: How climate change affects extreme weather around the world

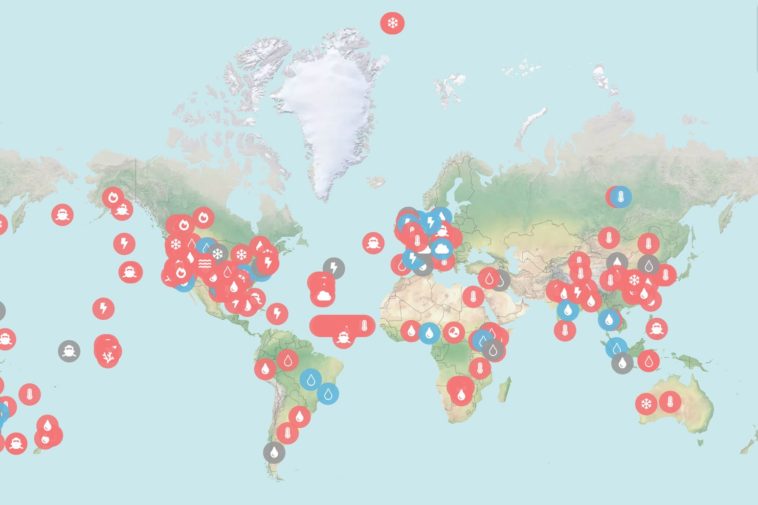
Data visualization : Mapped: How climate change affects extreme weather around the world

Mapped: How climate change affects extreme weather around the world

By avogadros_number

At infographic.tv we provide handpicked collection of the best infographics and data charts from around the world.

  • Don’t forget to share the love !
  • What do you think?

    459 points
    Upvote Downvote

    Leave a Reply

    Your email address will not be published. Required fields are marked *

    Loading…

    Visual : CYBER KILL CHAIN?

    Map : Original maps I found showing the old west. Dakota and Indian Territories