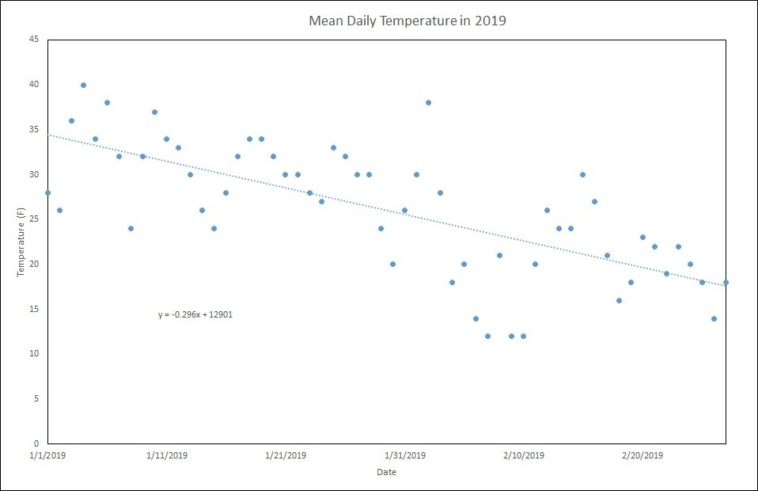
Data visualization : Mean daily temperature of my western US city in 2019 [OC]
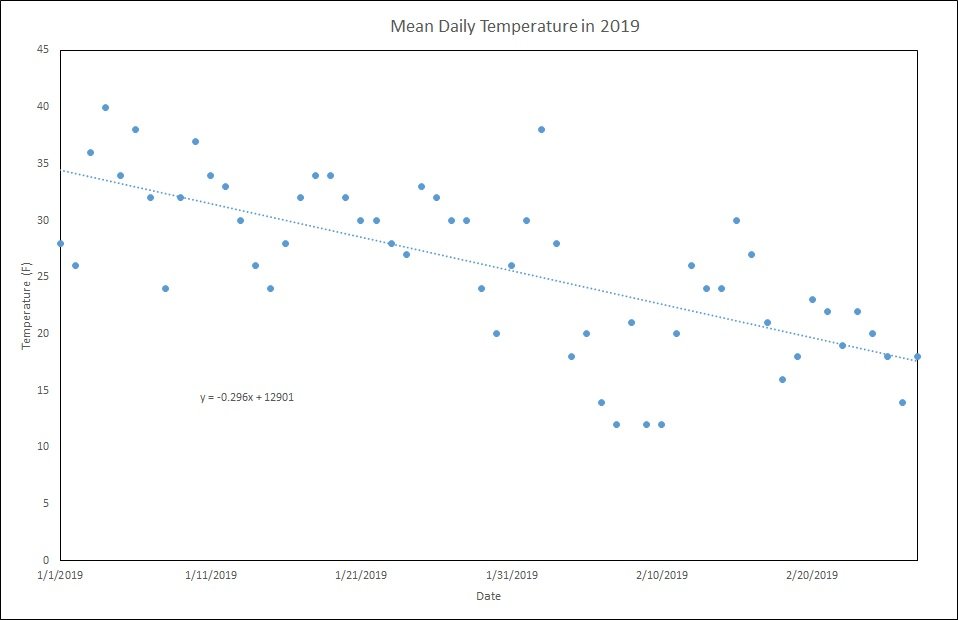
Mean daily temperature of my western US city in 2019 [OC]
By finchdad
At infographic.tv we provide handpicked collection of the best infographics and data charts from around the world.