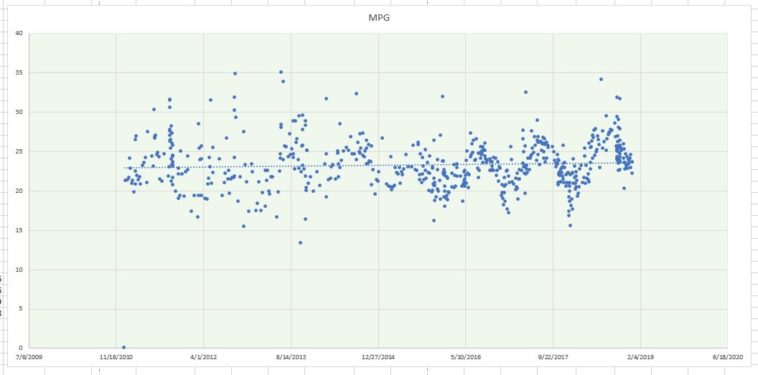
Data visualization : MPG of my 2006 Escape tracked and charted in Excel over 8 years (624 fill ups so far). Starts with 116k miles when purchased, just passed 258k yesterday! [OC]
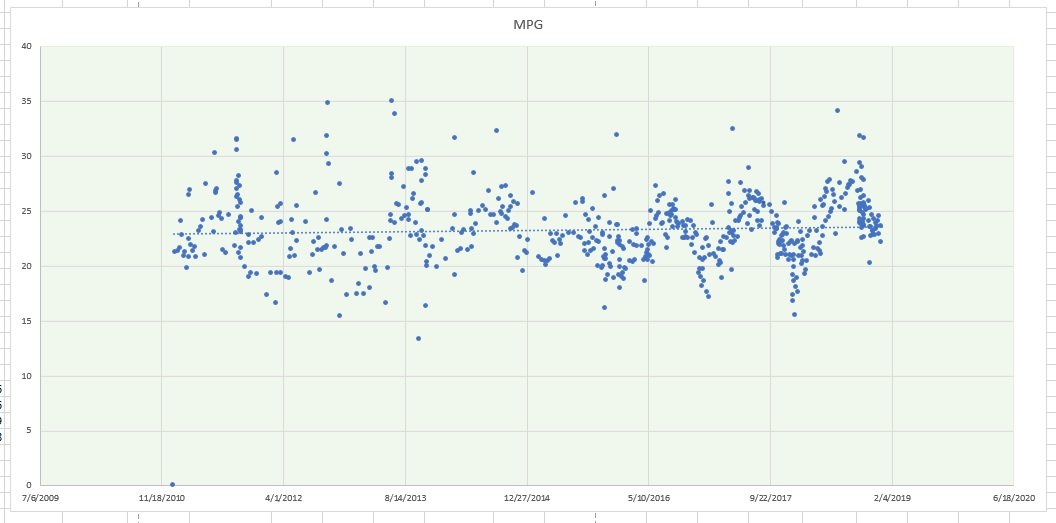
MPG of my 2006 Escape tracked and charted in Excel over 8 years (624 fill ups so far). Starts with 116k miles when purchased, just passed 258k yesterday! [OC]
By FieldForester
At infographic.tv we provide handpicked collection of the best infographics and data charts from around the world.