Data visualization : New Data Shows Why Van Gogh Changed His Color Palette
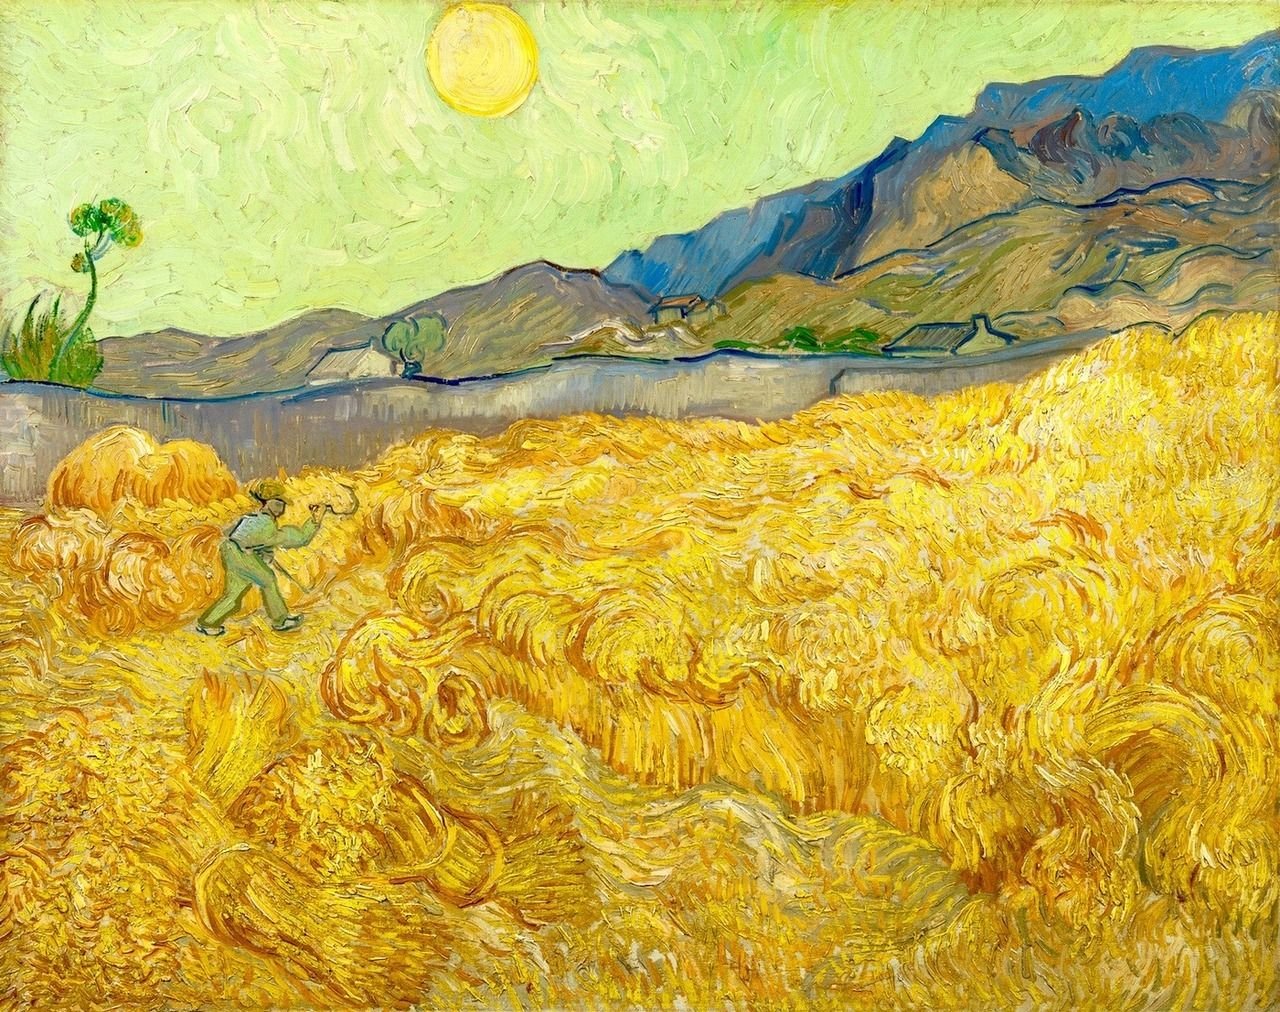
New Data Shows Why Van Gogh Changed His Color Palette
By hoopism
At infographic.tv we provide handpicked collection of the best infographics and data charts from around the world.