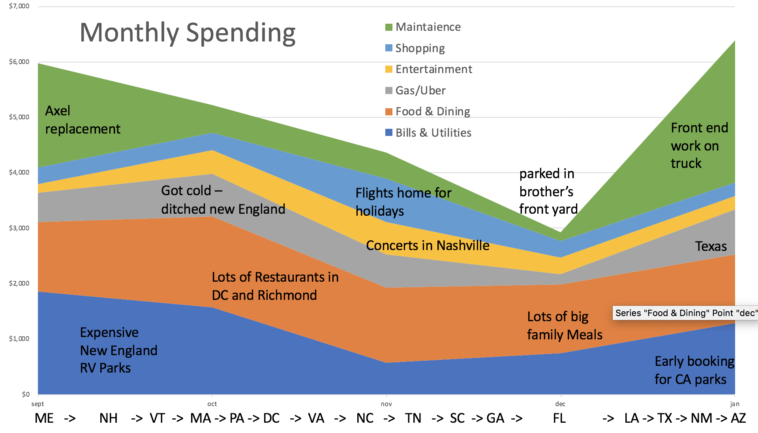
Data visualization : [OC] A breakdown of spending from 2 digital nomads’ first 5 months working from the road (in a camper) while exploring the US
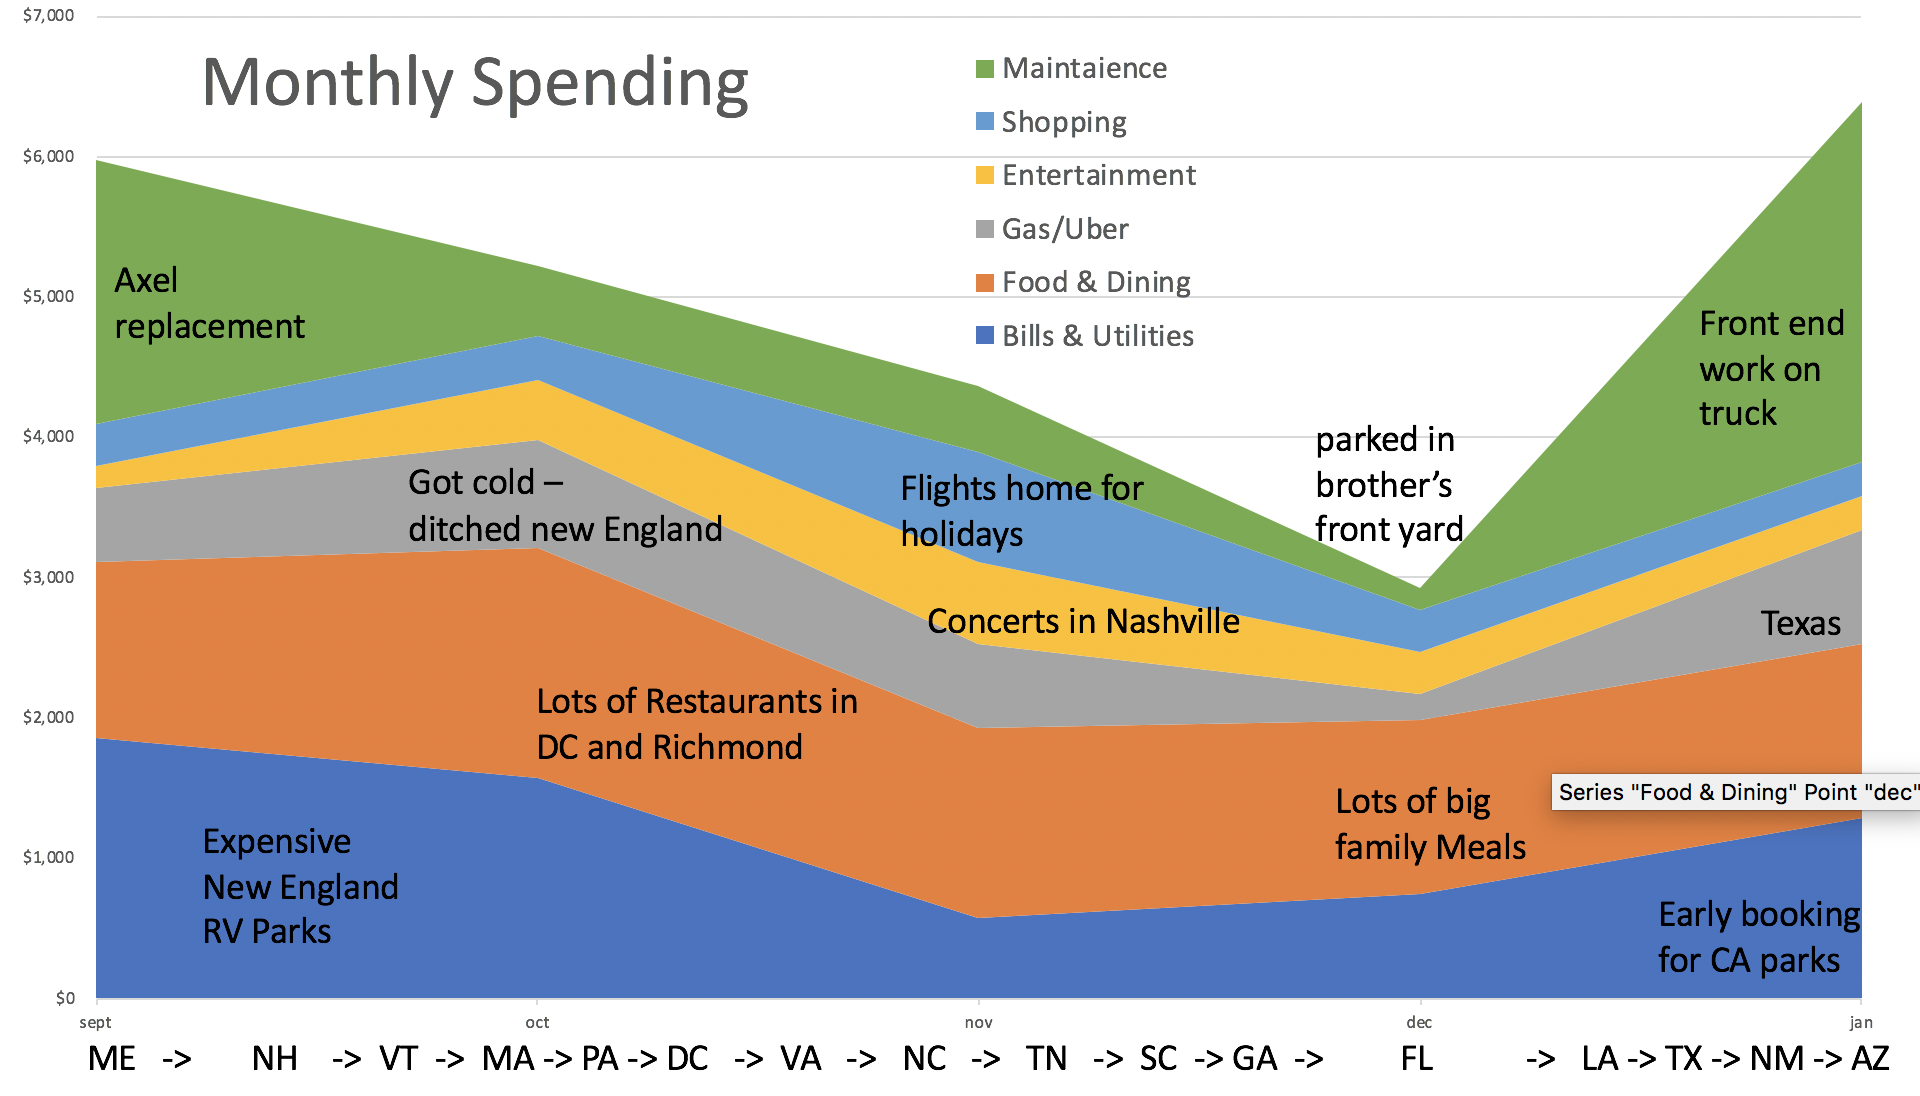
[OC] A breakdown of spending from 2 digital nomads’ first 5 months working from the road (in a camper) while exploring the US
By HateToBeABuzzKillBut
At infographic.tv we provide handpicked collection of the best infographics and data charts from around the world.