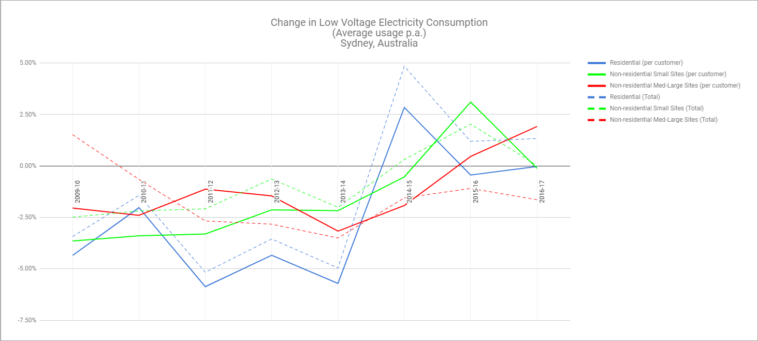
Data visualization : [OC] Change in Low Voltage Electricity Consumption (Average usage p.a.) Sydney, Australia
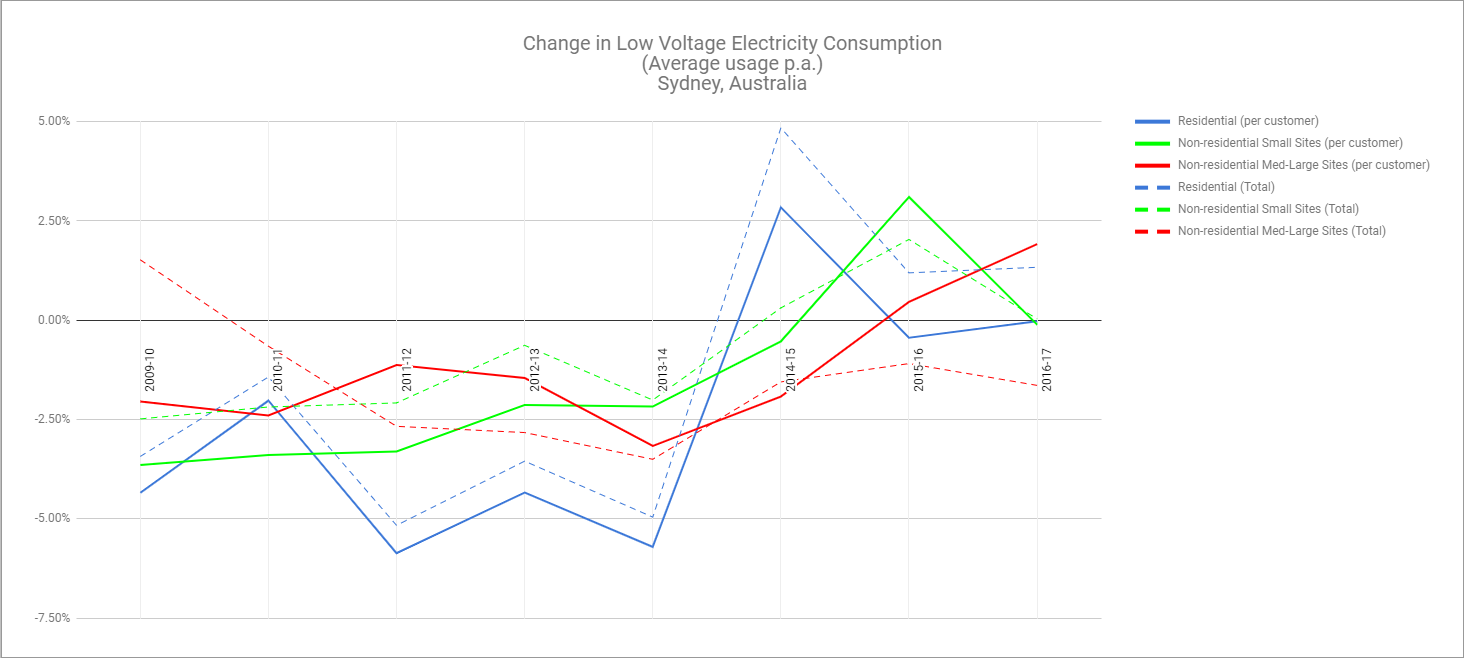
[OC] Change in Low Voltage Electricity Consumption (Average usage p.a.) Sydney, Australia
By Felix7747
At infographic.tv we provide handpicked collection of the best infographics and data charts from around the world.