Data visualization : [OC] Every hour of my 2018 graphically represented
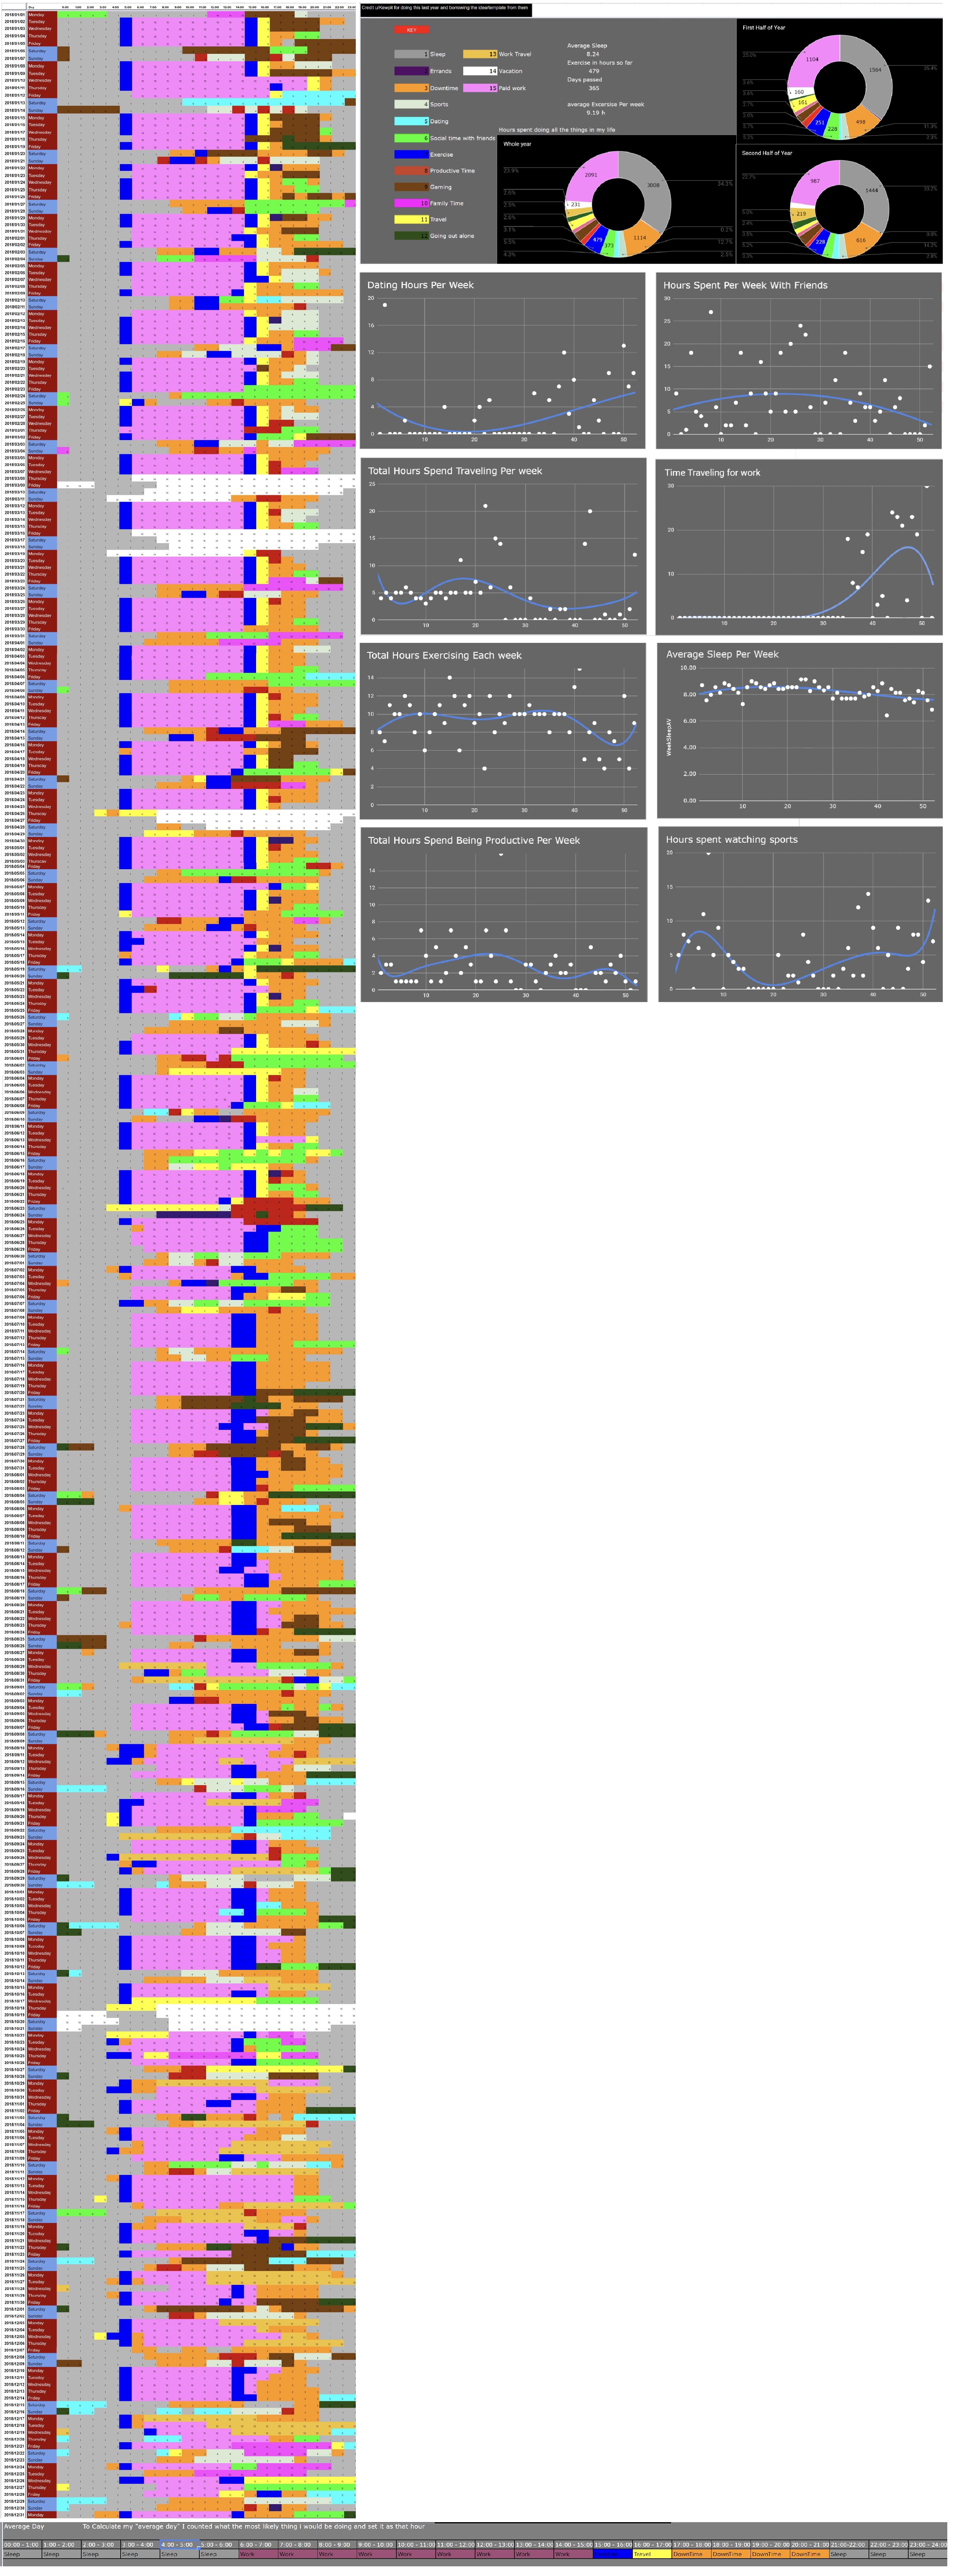
[OC] Every hour of my 2018 graphically represented
By JDwight53
At infographic.tv we provide handpicked collection of the best infographics and data charts from around the world.