in

data visualization : [OC] Explore Canada’s annual GHG emissions data by province, territory and sector between 1990 and 2016

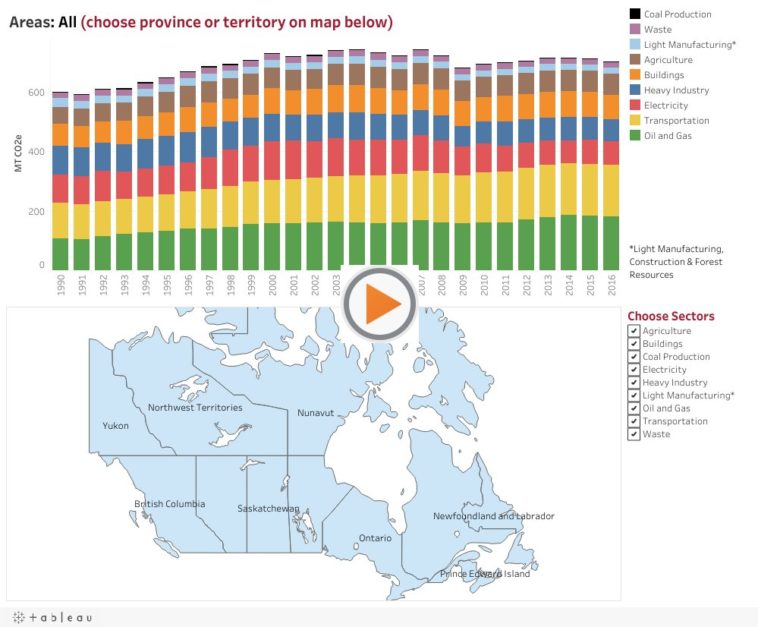
Data visualization : [OC] Explore Canada’s annual GHG emissions data by province, territory and sector between 1990 and 2016

[OC] Explore Canada’s annual GHG emissions data by province, territory and sector between 1990 and 2016

By energyinfo-NEB

At infographic.tv we provide handpicked collection of the best infographics and data charts from around the world.

  • Don’t forget to share the love !
  • What do you think?

    459 points
    Upvote Downvote

    Leave a Reply

    Your email address will not be published. Required fields are marked *

    Loading…

    Map : Map of Dublin – 1797

    Infographic : Its Perfect time to plan your content strategy. Create a great Compelling and information-rich content strategy and lead 2019 with high traffic and ROI. #marketing #planning #contentmarketing #contentstrategy