Data visualization : [OC] Fouls during an NBA season as a function of game competitiveness.
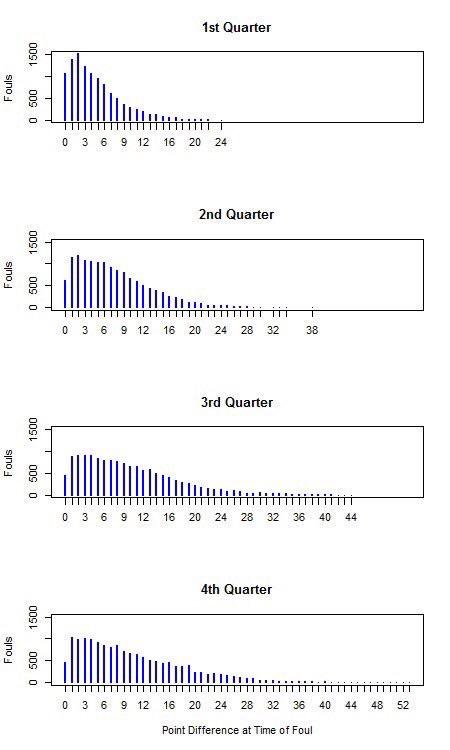
[OC] Fouls during an NBA season as a function of game competitiveness.
By wtreyhillphd
At infographic.tv we provide handpicked collection of the best infographics and data charts from around the world.