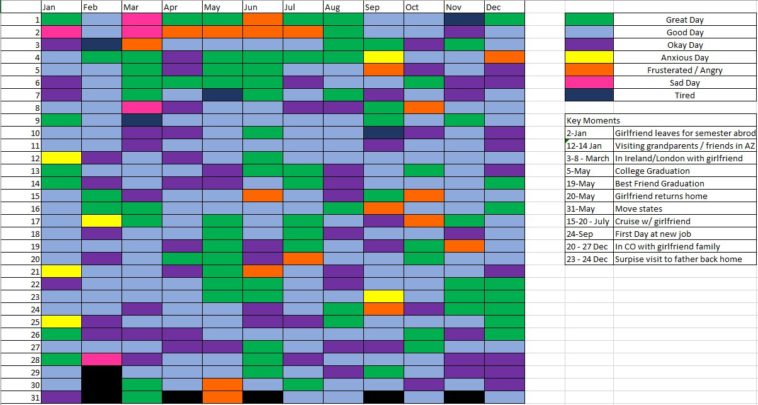
Data visualization : [OC] I also tracked my mood at the end of each day in 2018
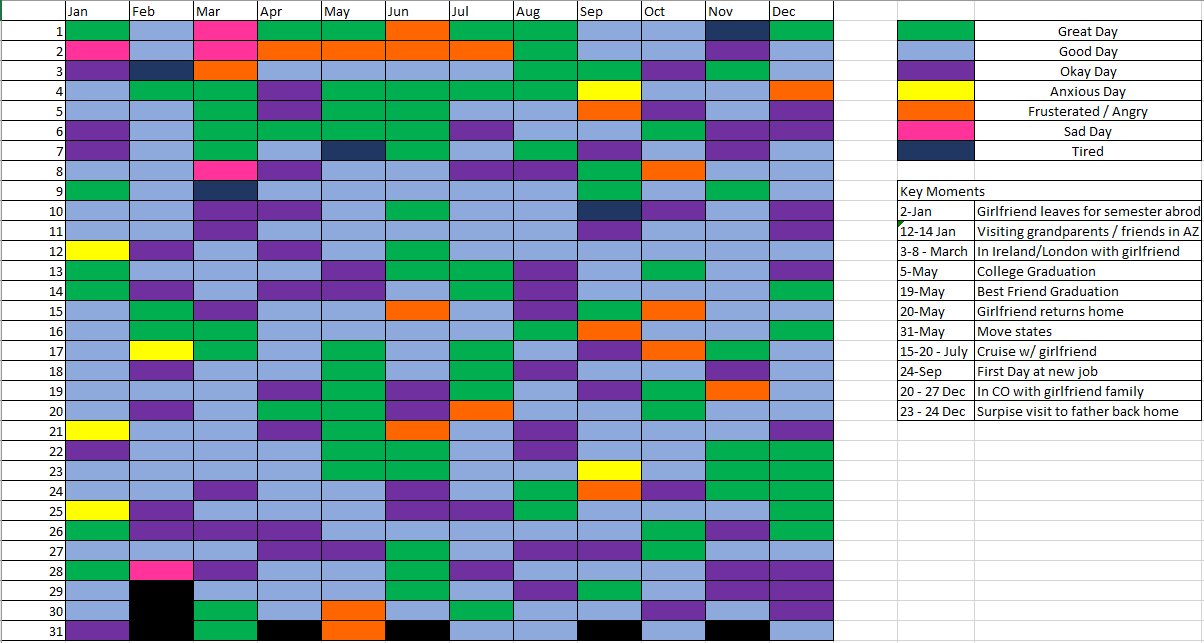
[OC] I also tracked my mood at the end of each day in 2018
By BurntToast13
At infographic.tv we provide handpicked collection of the best infographics and data charts from around the world.