Data visualization : [OC] I designed a calendar that uses sunrise and sunset data to generate a location specific visualisation of daylight throughout the year.
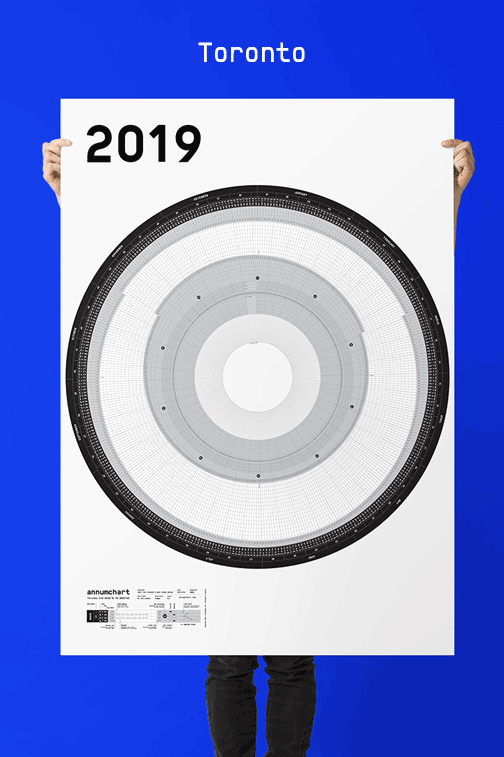
[OC] I designed a calendar that uses sunrise and sunset data to generate a location specific visualisation of daylight throughout the year.
By differred
At infographic.tv we provide handpicked collection of the best infographics and data charts from around the world.