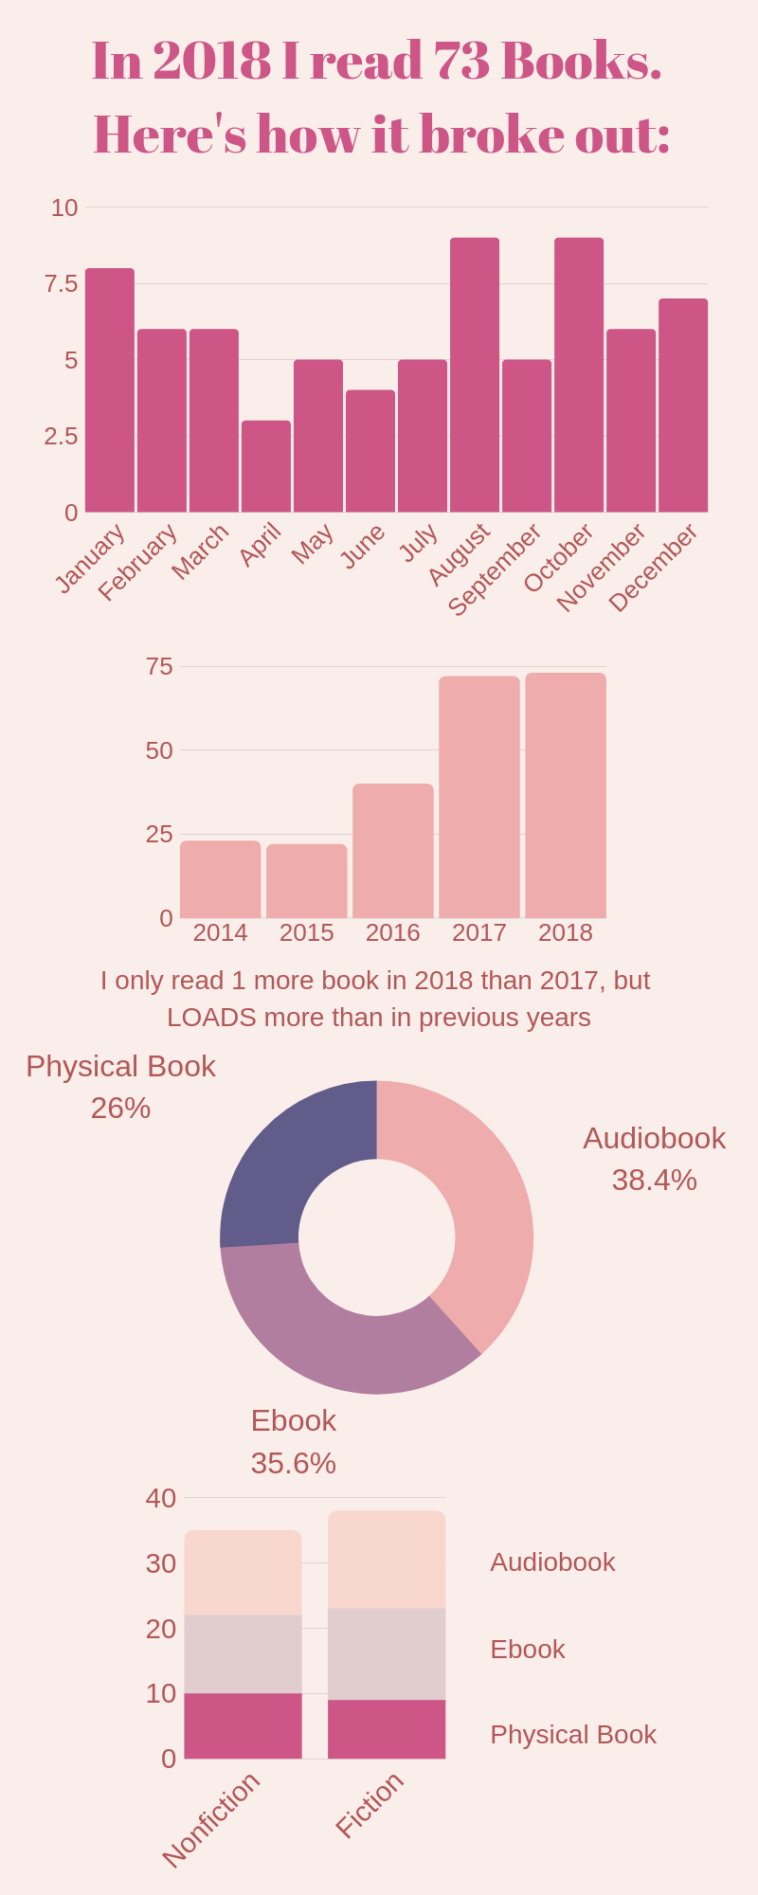
Data visualization : [OC] In 2018 I read 73 books. Here’s how it broke out, and how it compared to previous years:

[OC] In 2018 I read 73 books. Here’s how it broke out, and how it compared to previous years:
By lizerob
At infographic.tv we provide handpicked collection of the best infographics and data charts from around the world.


