Data visualization : [OC] Inspired by a post from last year, I documented my daily emotions in 2018

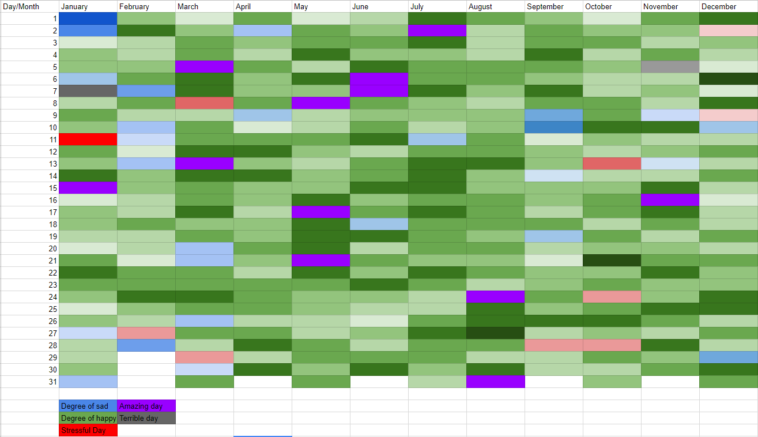
[OC] Inspired by a post from last year, I documented my daily emotions in 2018
By Based_Fermata
At infographic.tv we provide handpicked collection of the best infographics and data charts from around the world.