Data visualization : [OC] My BMI: 10 years (Jan. 2009 – Dec. 2018) (measurements taken once a month)
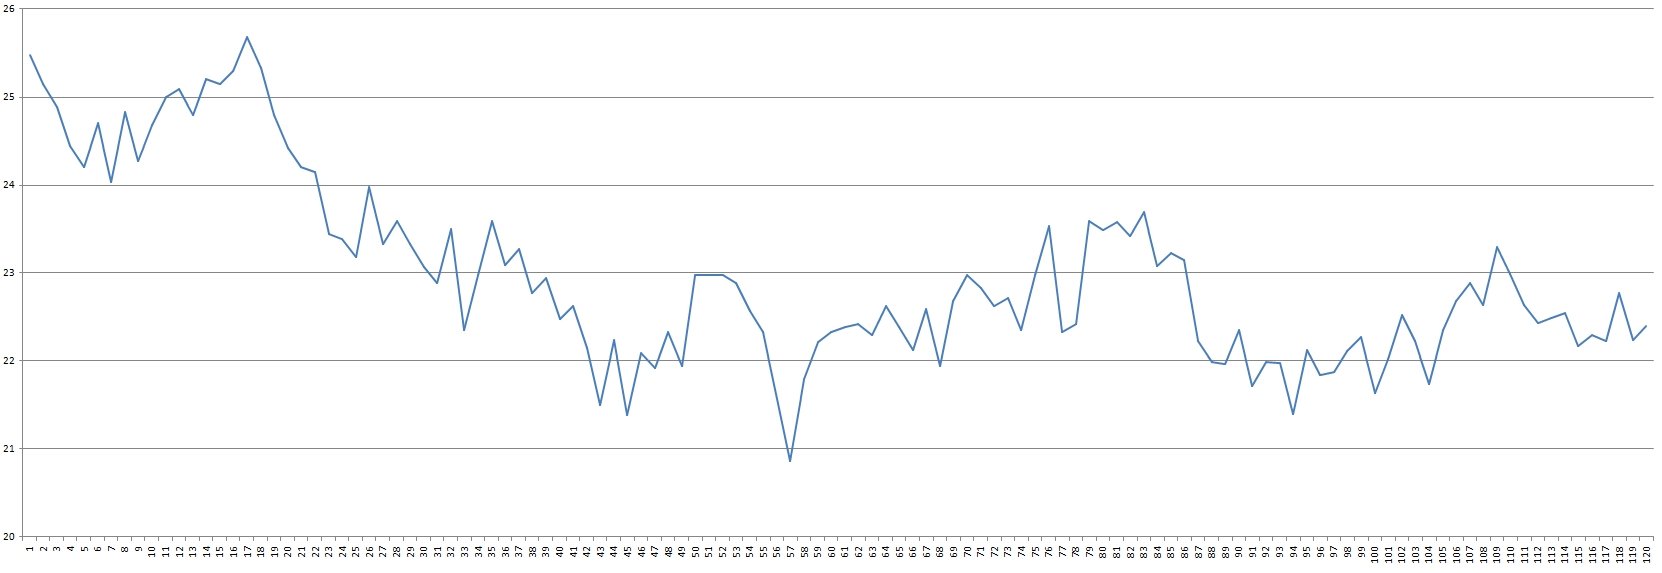
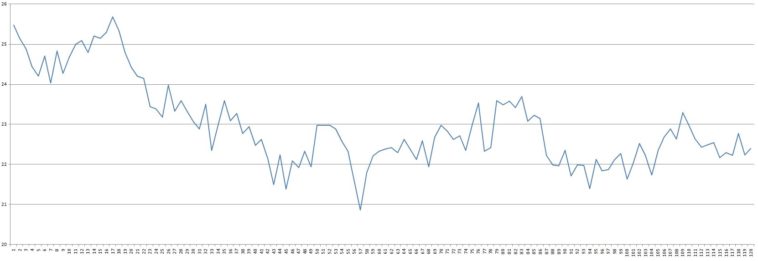
[OC] My BMI: 10 years (Jan. 2009 – Dec. 2018) (measurements taken once a month)
By ieatbeet
At infographic.tv we provide handpicked collection of the best infographics and data charts from around the world.