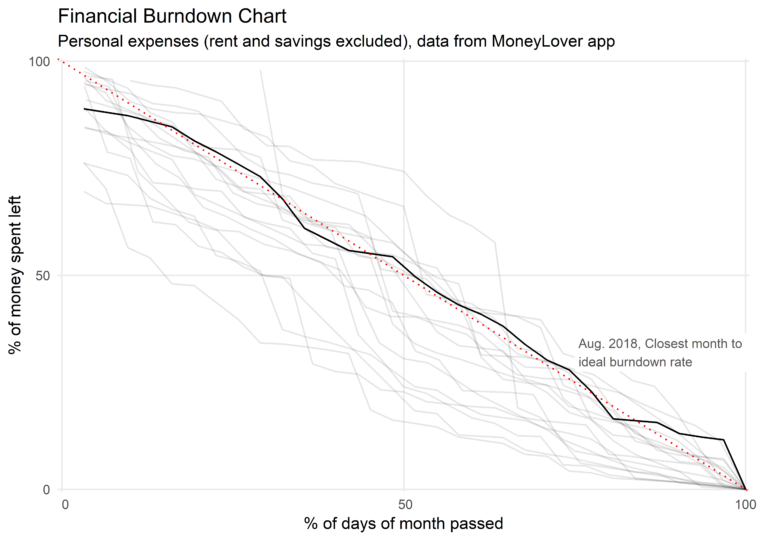
Data visualization : [OC] Personal Financial burndown chart. I tend to spend more money at the start of the month.
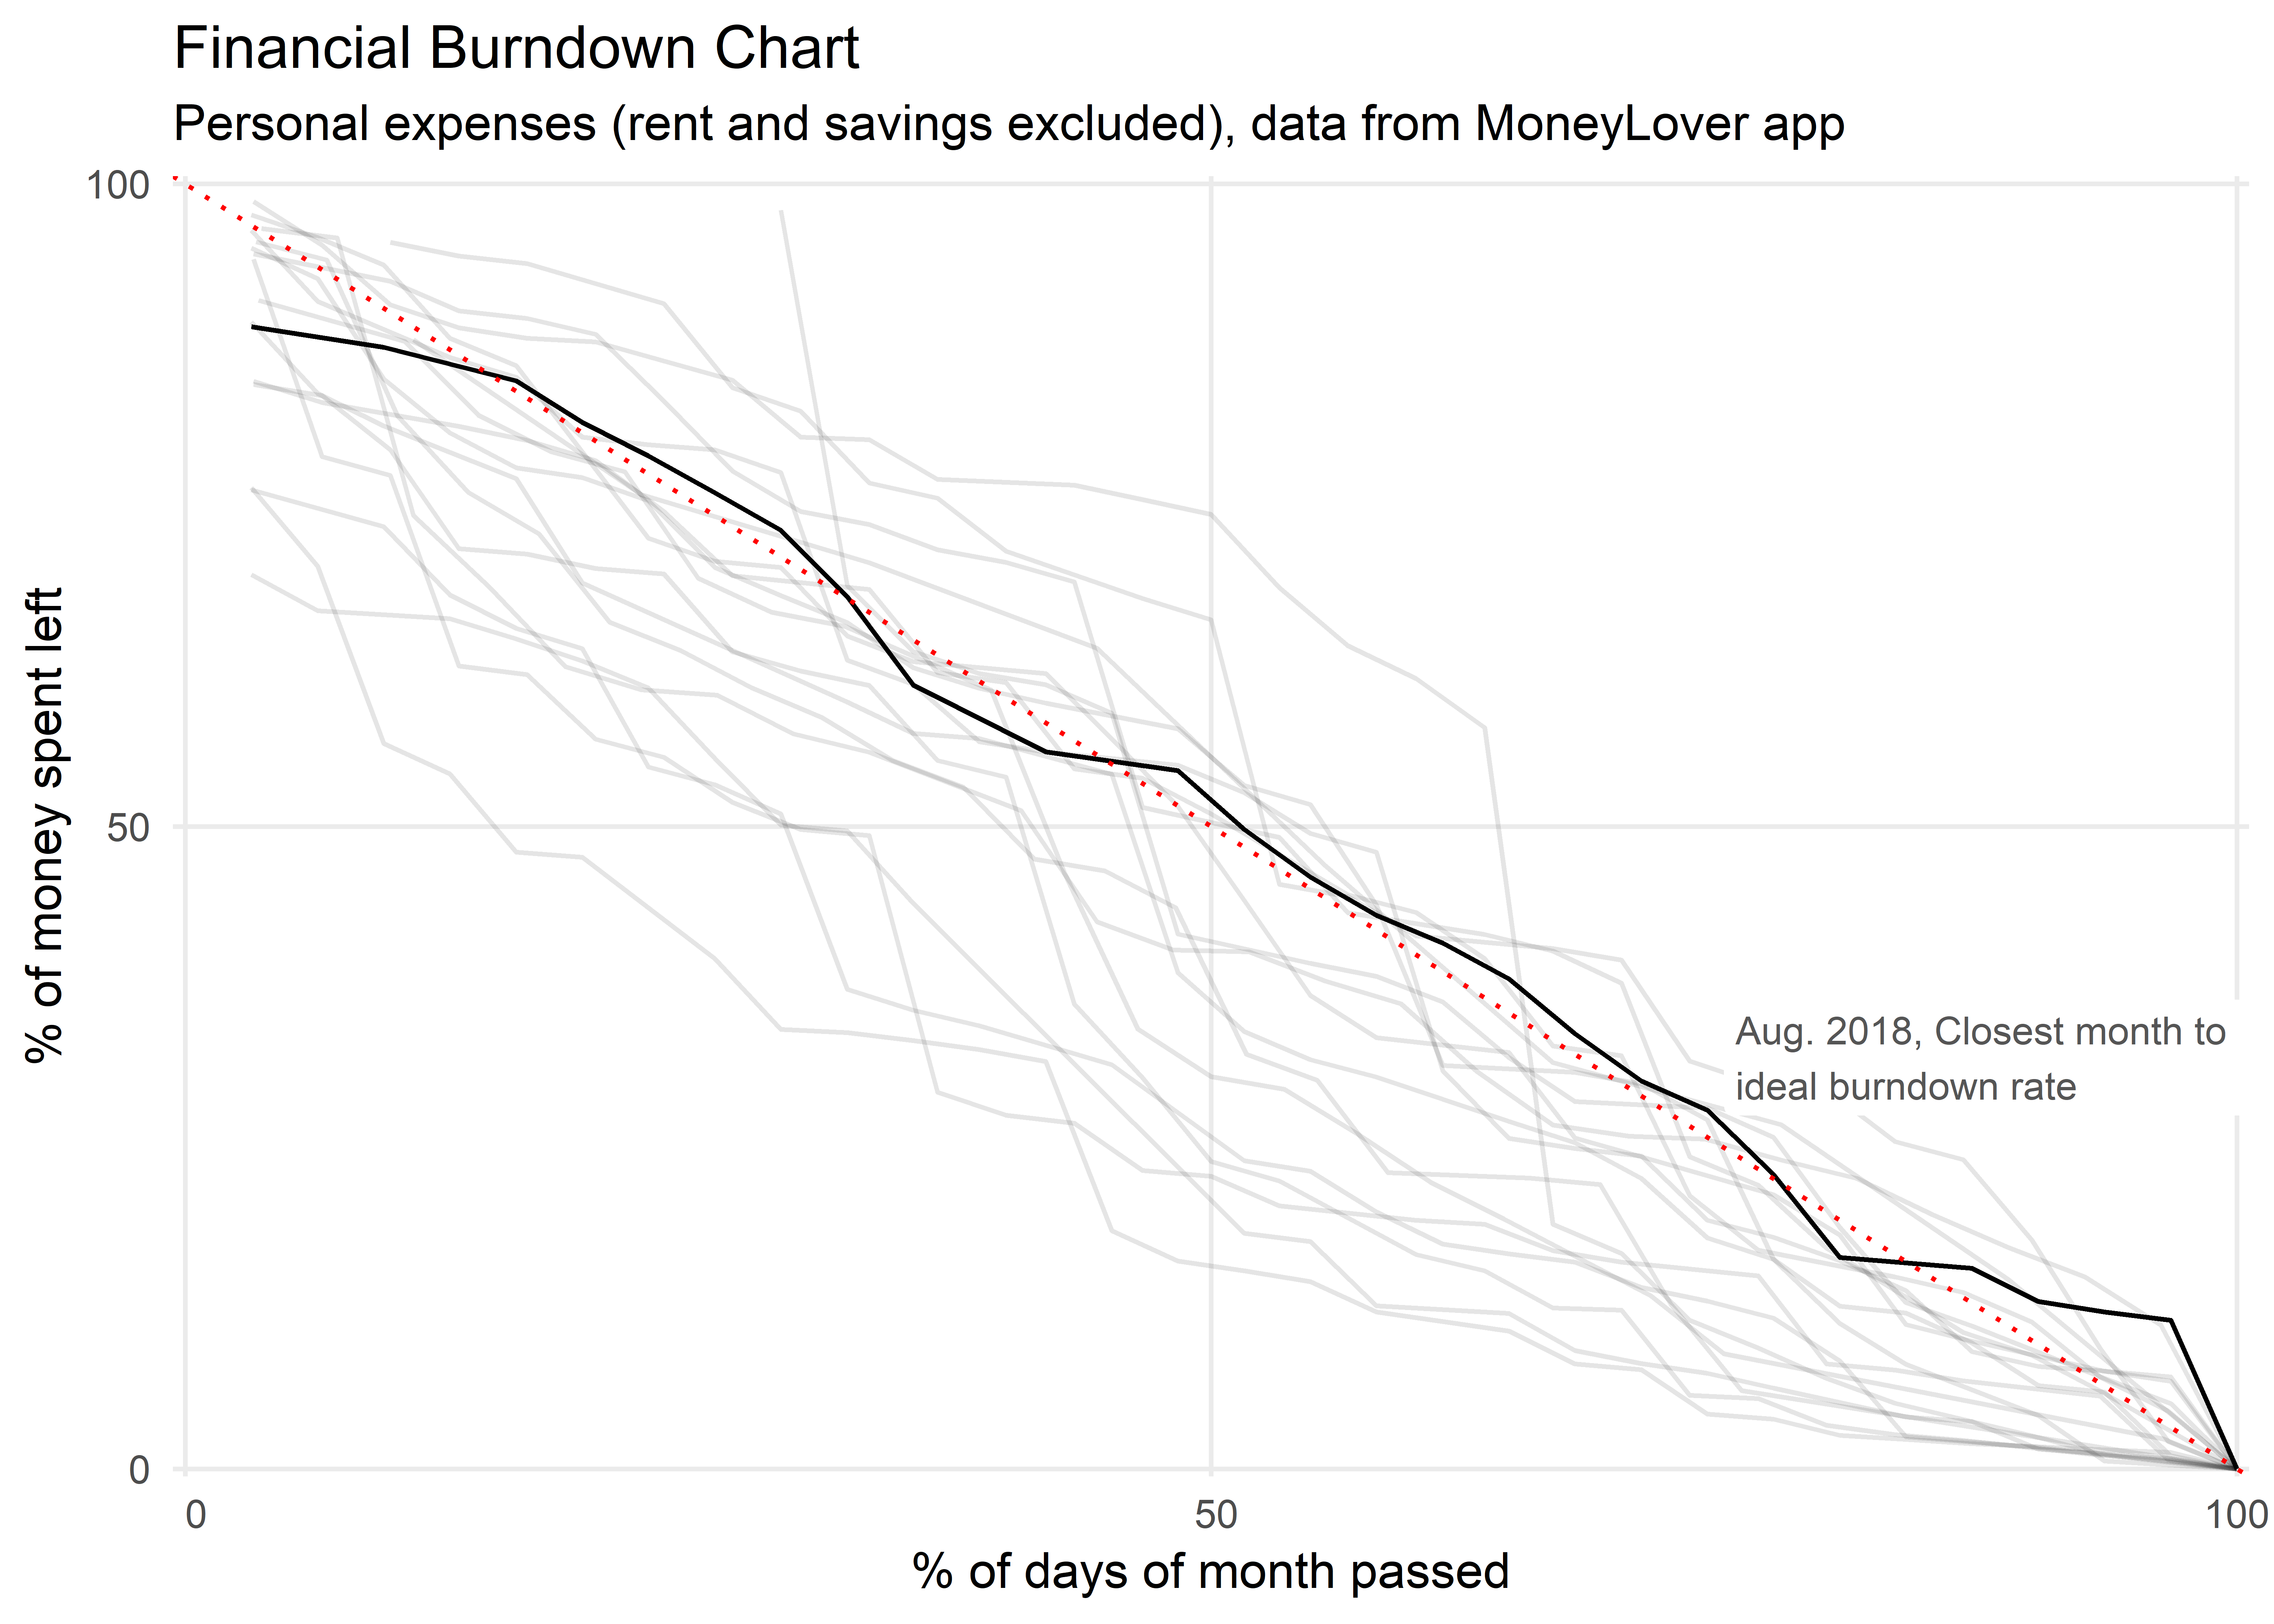
[OC] Personal Financial burndown chart. I tend to spend more money at the start of the month.
By comoor
At infographic.tv we provide handpicked collection of the best infographics and data charts from around the world.