in

data visualization : [OC] Server location visualization of top 500 websites (by traffic)

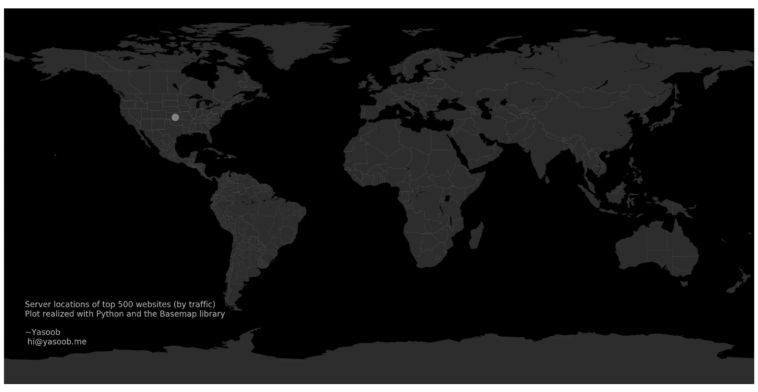
Data visualization : [OC] Server location visualization of top 500 websites (by traffic)

[OC] Server location visualization of top 500 websites (by traffic)

By yasoob_python

At infographic.tv we provide handpicked collection of the best infographics and data charts from around the world.

  • Don’t forget to share the love !
  • What do you think?

    459 points
    Upvote Downvote

    Leave a Reply

    Your email address will not be published. Required fields are marked *

    Loading…

    Data Chart : These Social Media Trends Are On The Rise In 2018 [Infographic

    Map : Spongy Land: Operational Navigation Chart of Northern Canada (Great Slave Lake Region) [9254 x 6662]