Data visualization : [OC] The Average SAT Scores of Incoming College Freshman by State, 2000-2016
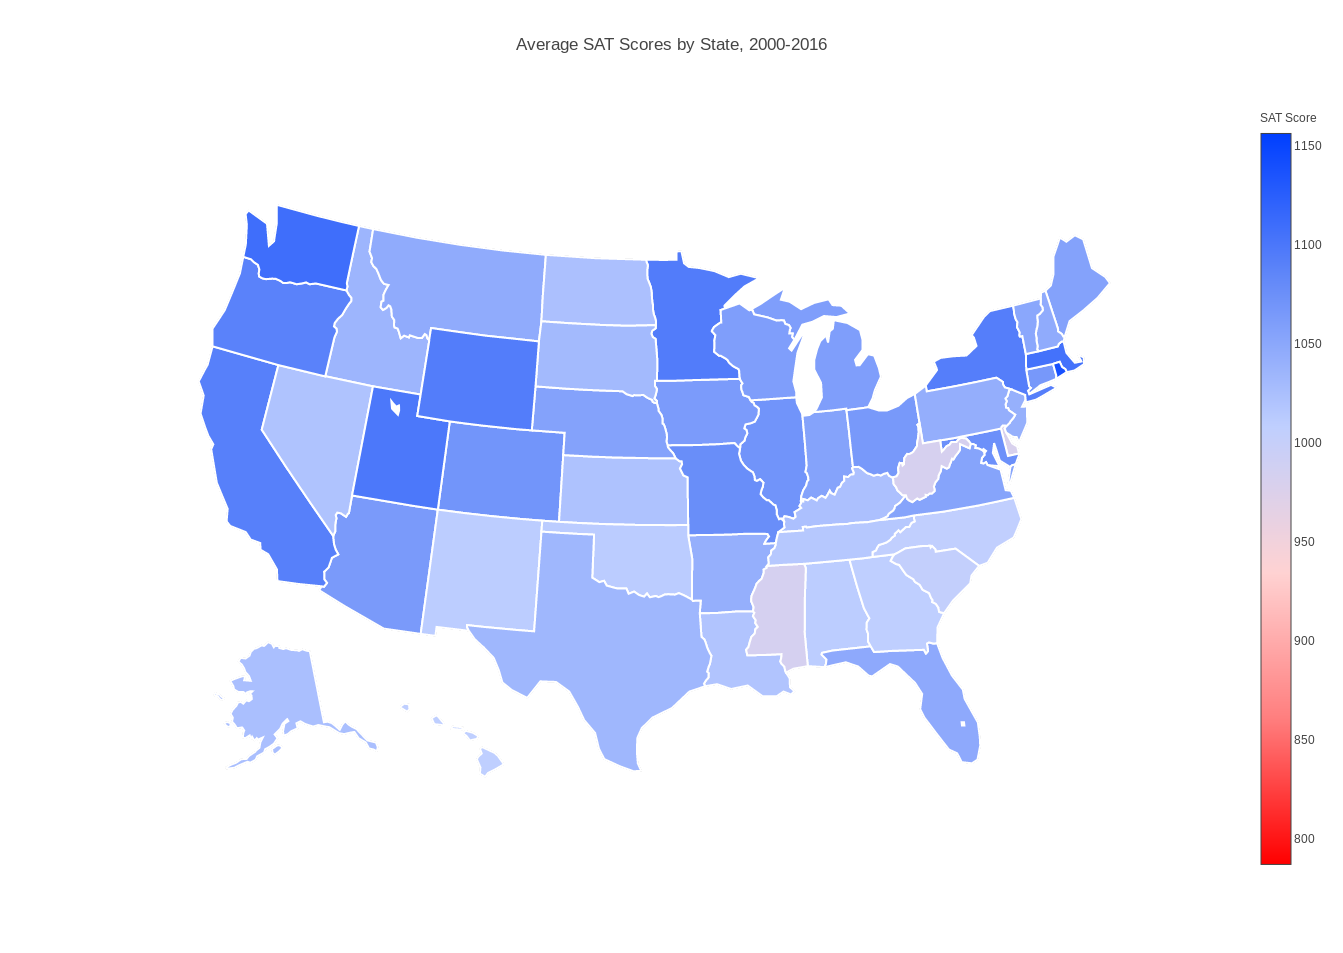
[OC] The Average SAT Scores of Incoming College Freshman by State, 2000-2016
By dantheman_19
At infographic.tv we provide handpicked collection of the best infographics and data charts from around the world.