Data visualization : [OC] Visualizing Multi-Stage Selection Processes using Galton’s Bean Machine [OC] (TypeScript/CSS/HTML)
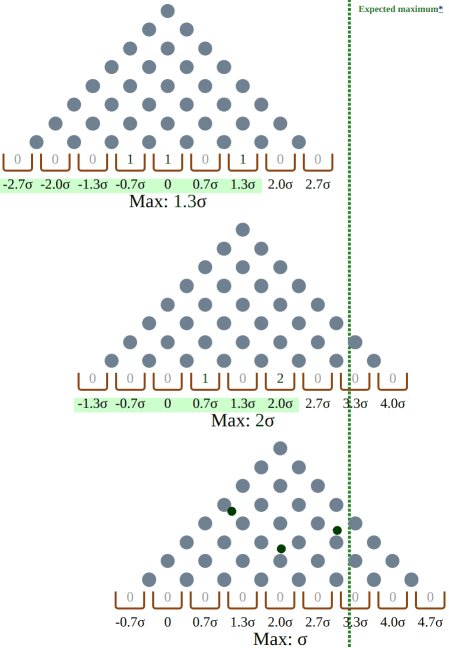
[OC] Visualizing Multi-Stage Selection Processes using Galton’s Bean Machine [OC] (TypeScript/CSS/HTML)
By gwern
At infographic.tv we provide handpicked collection of the best infographics and data charts from around the world.