in

data visualization : Shrinking of the Freeze-Thaw Cycle – Lake Mendota, WI [OC]

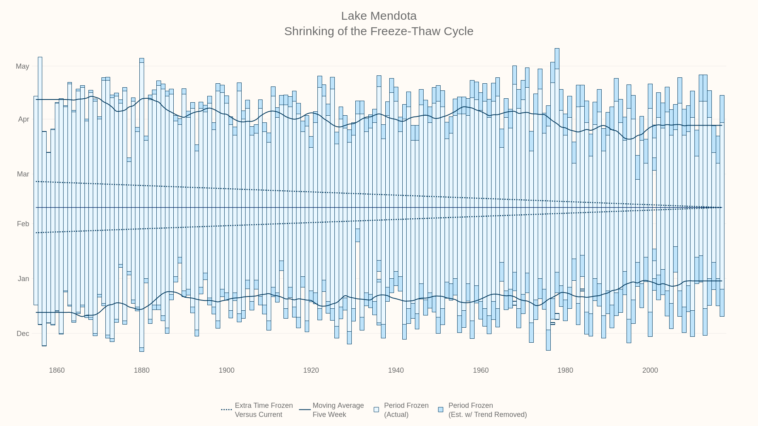
Data visualization : Shrinking of the Freeze-Thaw Cycle – Lake Mendota, WI [OC]

Shrinking of the Freeze-Thaw Cycle – Lake Mendota, WI [OC]

By RyBread7

At infographic.tv we provide handpicked collection of the best infographics and data charts from around the world.

  • Don’t forget to share the love !
  • What do you think?

    459 points
    Upvote Downvote

    Leave a Reply

    Your email address will not be published. Required fields are marked *

    Loading…

    Video Infographic : Infographic Animation: Roamware Corporate

    Data Chart : How Color Meanings Clash Across Cultures [Infographic