Data visualization : Super Bowl Squares analysis: best numbers to draw, differences by quarter [OC]
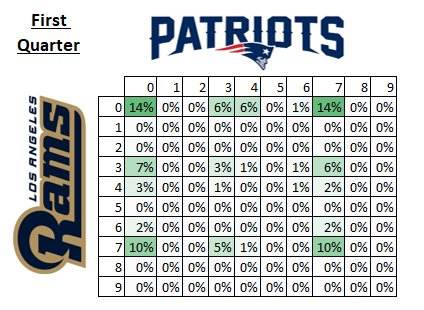
Super Bowl Squares analysis: best numbers to draw, differences by quarter [OC]
By chadmichaelhorner
At infographic.tv we provide handpicked collection of the best infographics and data charts from around the world.