in

data visualization : The world’s economic centre of gravity from 1AD to 2025, using an average of countries’ locations weighted by their GDP.
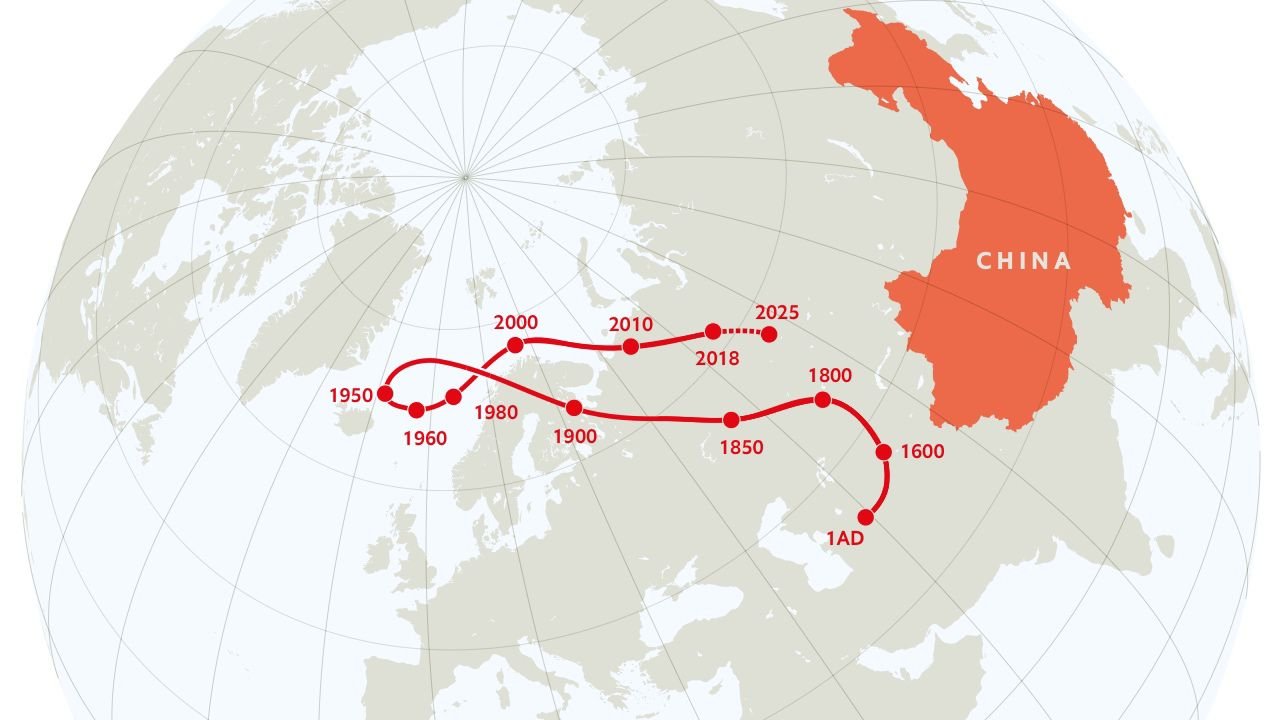
Data visualization : The world’s economic centre of gravity from 1AD to 2025, using an average of countries’ locations weighted by their GDP.

The world’s economic centre of gravity from 1AD to 2025, using an average of countries’ locations weighted by their GDP.

By Sea_Tee

At infographic.tv we provide handpicked collection of the best infographics and data charts from around the world.

  • Don’t forget to share the love !
  • What do you think?

    460 points
    Upvote Downvote

    Leave a Reply

    Your email address will not be published. Required fields are marked *

    Loading…

    Video Infographic : Terrifying Teens Who Killed in Cold Blood

    Visual : List of useful websites