Data visualization : Two “colorfield” plots displaying the distribution of discussion topics among users of r/opiates (more in comments) [OC]
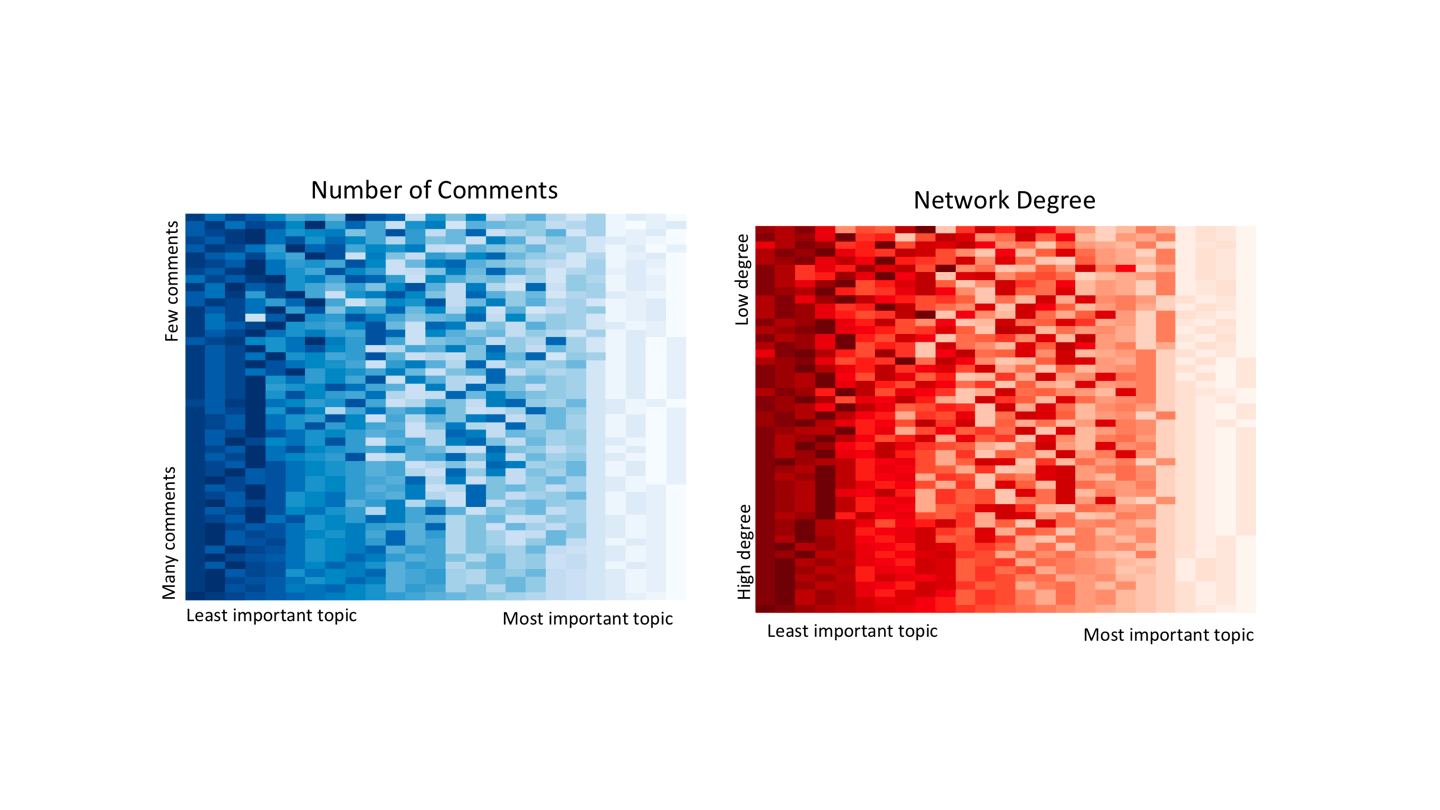
Two “colorfield” plots displaying the distribution of discussion topics among users of r/opiates (more in comments) [OC]
By zephyr1999
At infographic.tv we provide handpicked collection of the best infographics and data charts from around the world.