Data visualization : Visual Guide for Understanding Marginal Tax Rates For Regular and Capital Gains Income – United States 2019 [OC]

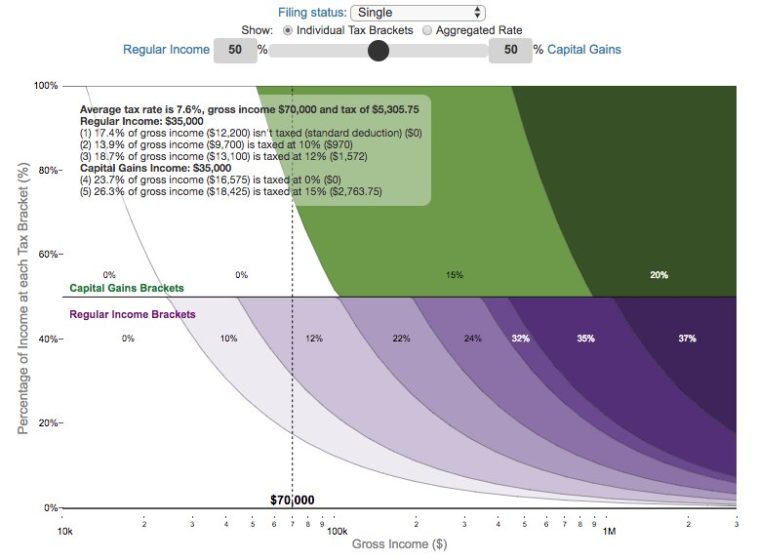
Visual Guide for Understanding Marginal Tax Rates For Regular and Capital Gains Income – United States 2019 [OC]
By EngagingData
At infographic.tv we provide handpicked collection of the best infographics and data charts from around the world.