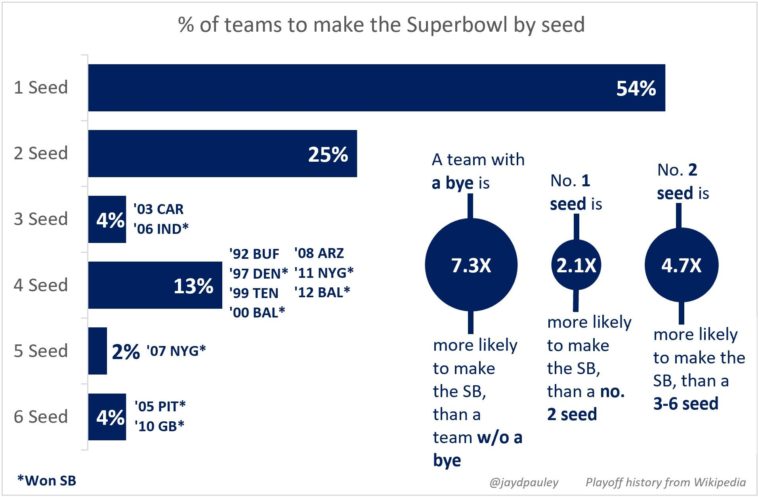
Data visualization : Visualization of NFL teams’s playoff success based on where they were seeded going into the playoffs. [OC]
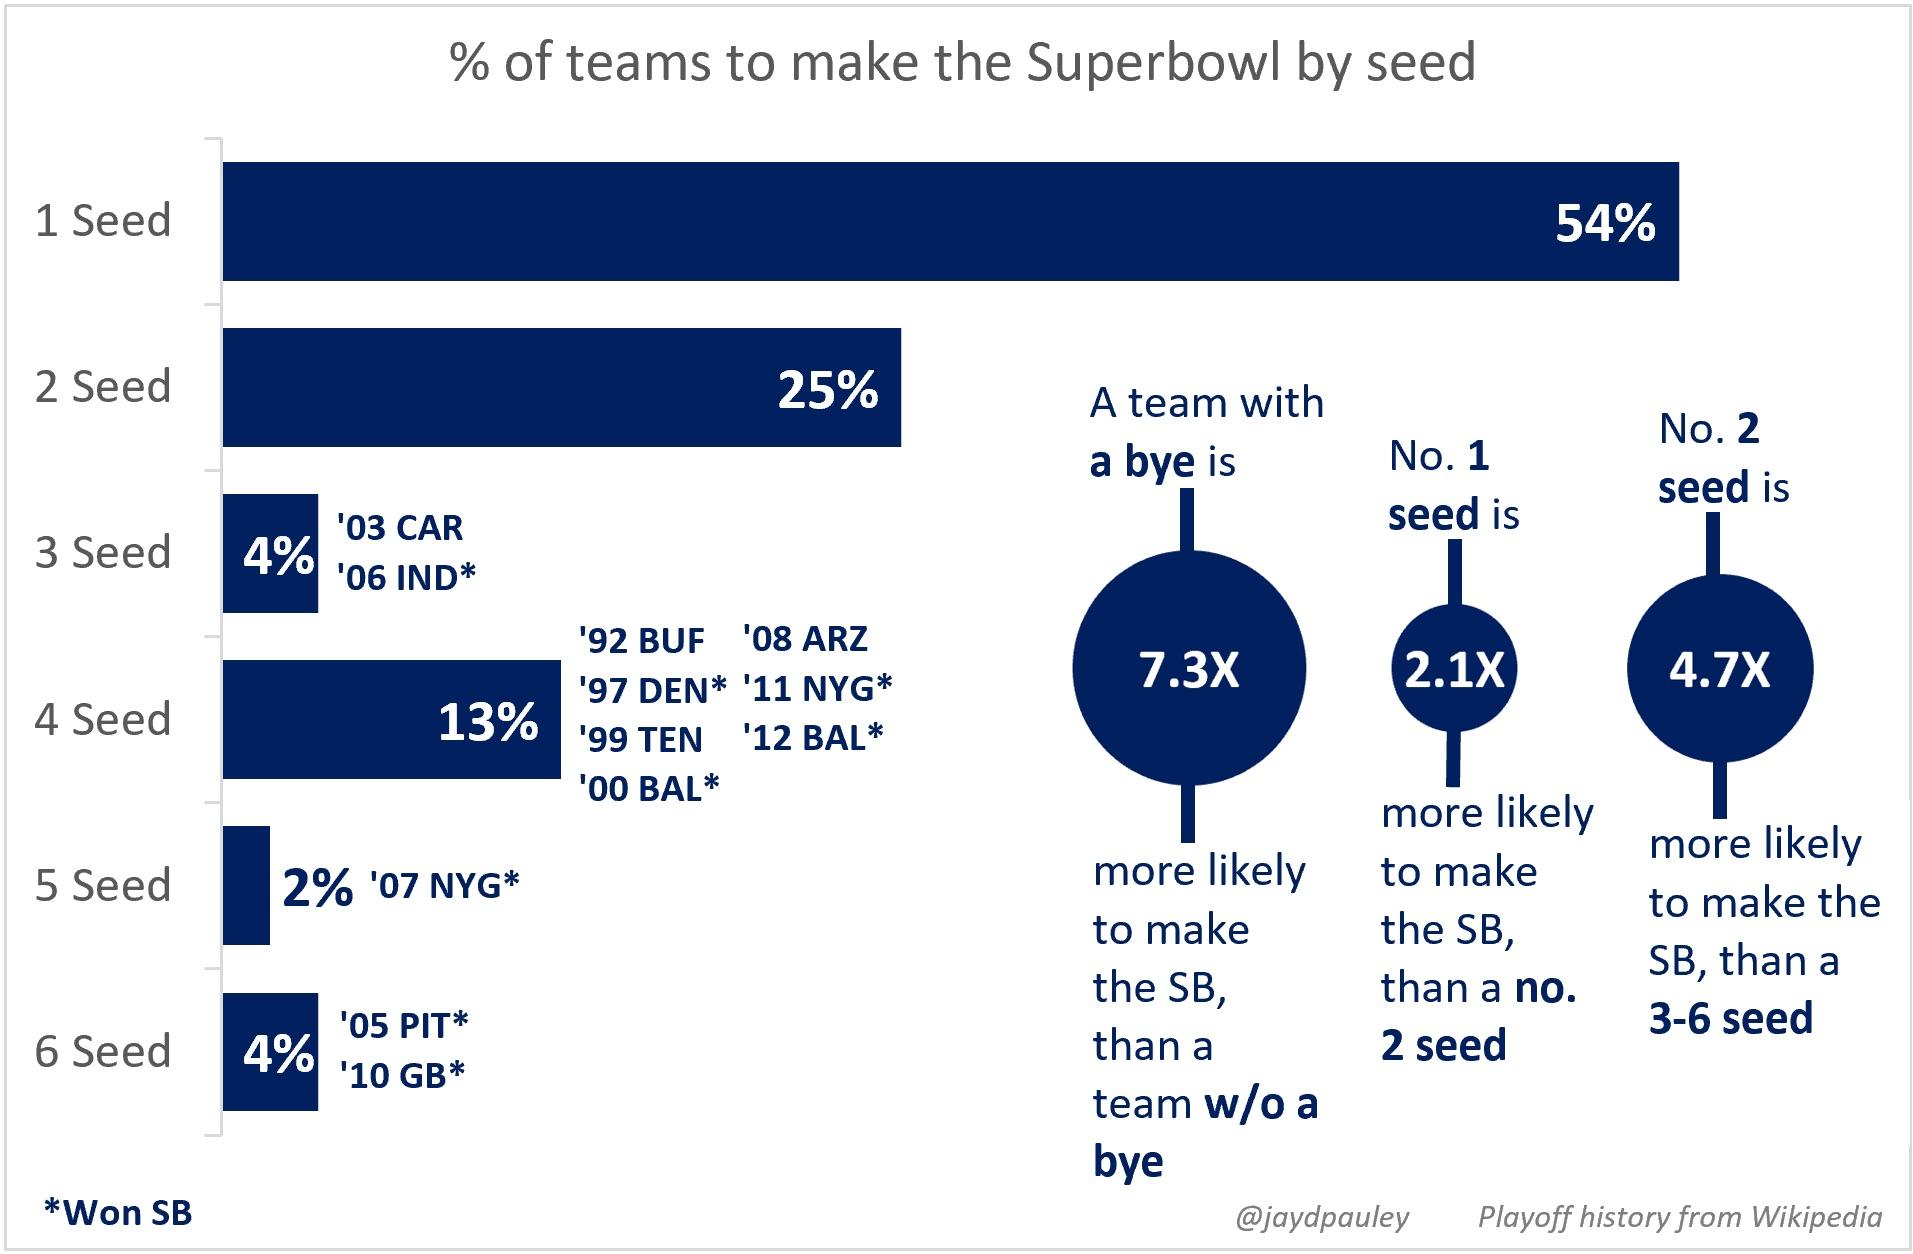
Visualization of NFL teams’s playoff success based on where they were seeded going into the playoffs. [OC]
By JPAnalyst
At infographic.tv we provide handpicked collection of the best infographics and data charts from around the world.