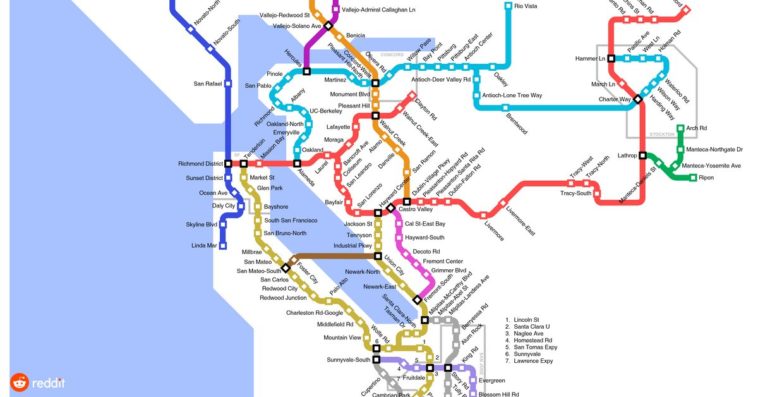
Data visualization : Visualization of Taco Bell’s if they were connected by rail in the SF Bay Area
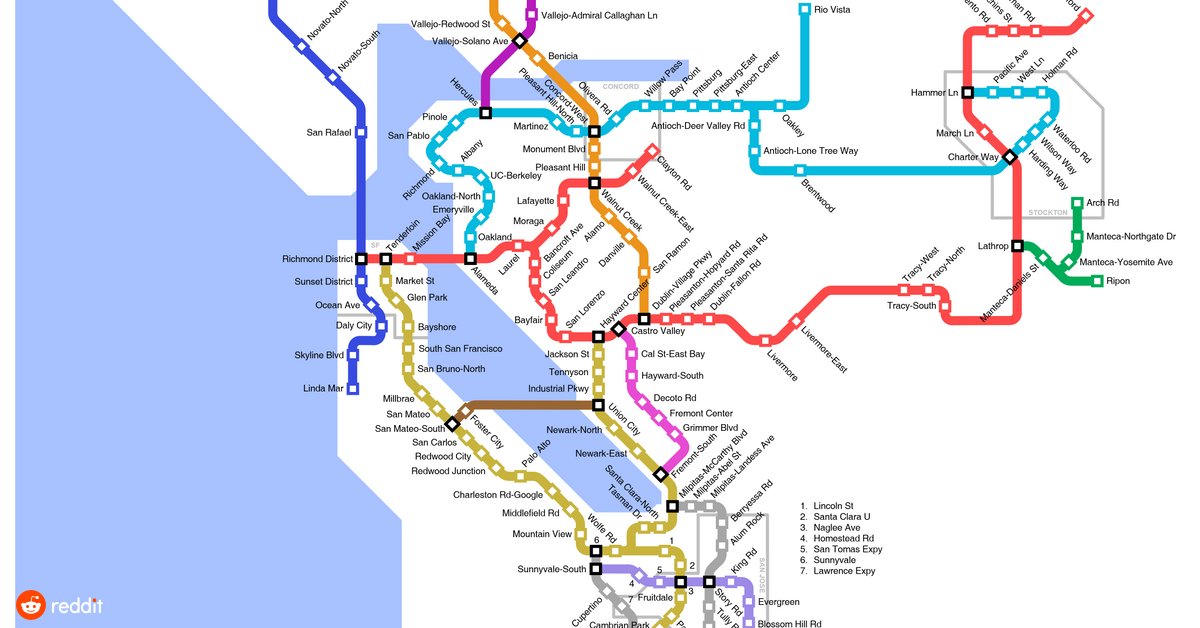
Visualization of Taco Bell’s if they were connected by rail in the SF Bay Area
By idarwishman
At infographic.tv we provide handpicked collection of the best infographics and data charts from around the world.