Data visualization : WA 2018 Carbon Tax Initiative Results by County [OC]
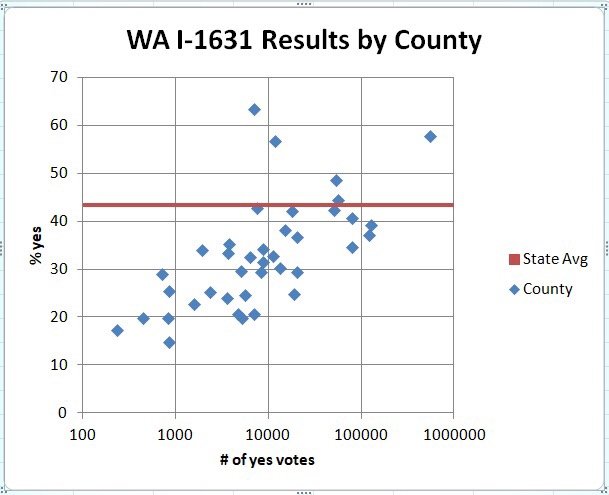
WA 2018 Carbon Tax Initiative Results by County [OC]
By psyche_da_mike
At infographic.tv we provide handpicked collection of the best infographics and data charts from around the world.