Infographic : This is a series of five infographics produced to accompany the…
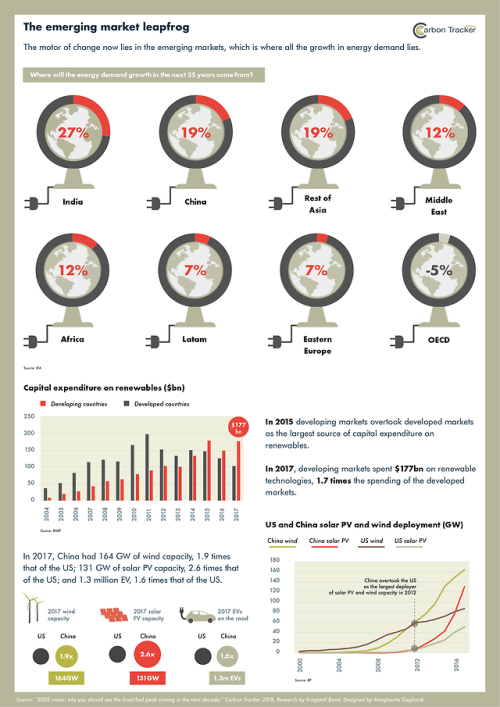
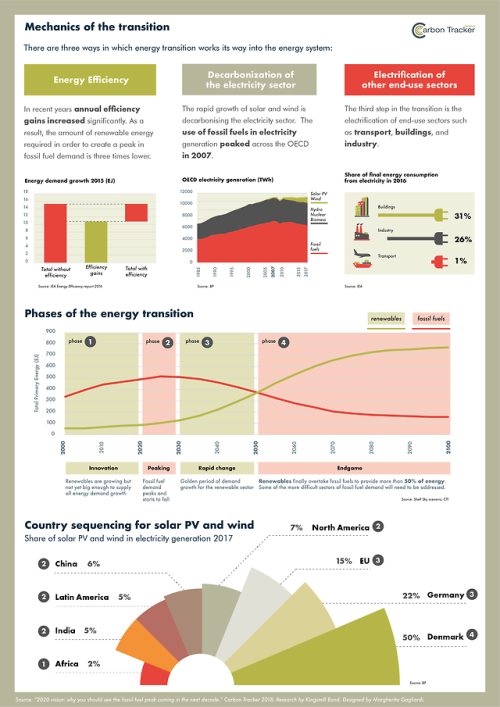
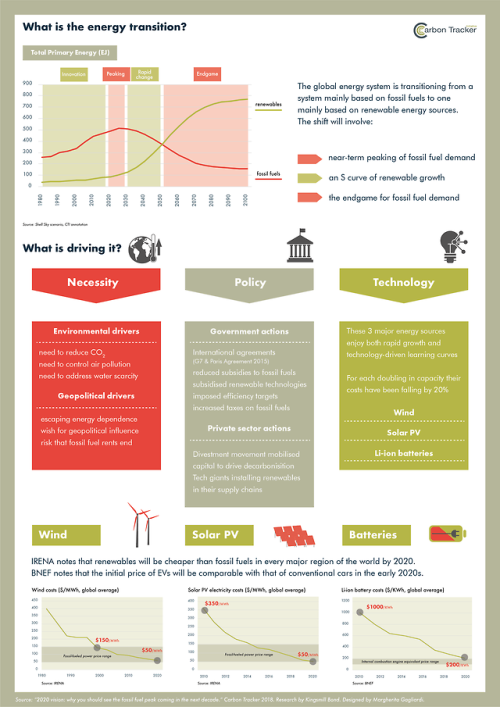
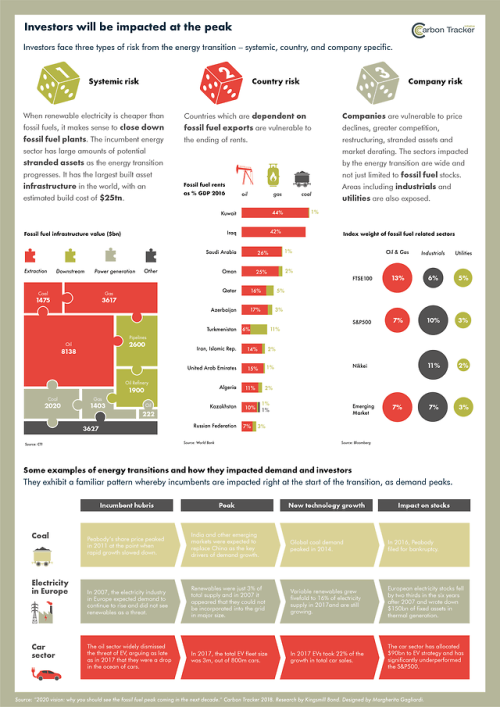
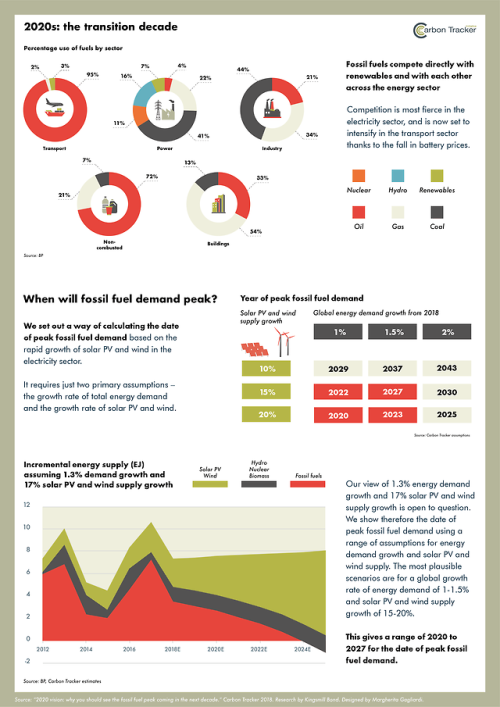
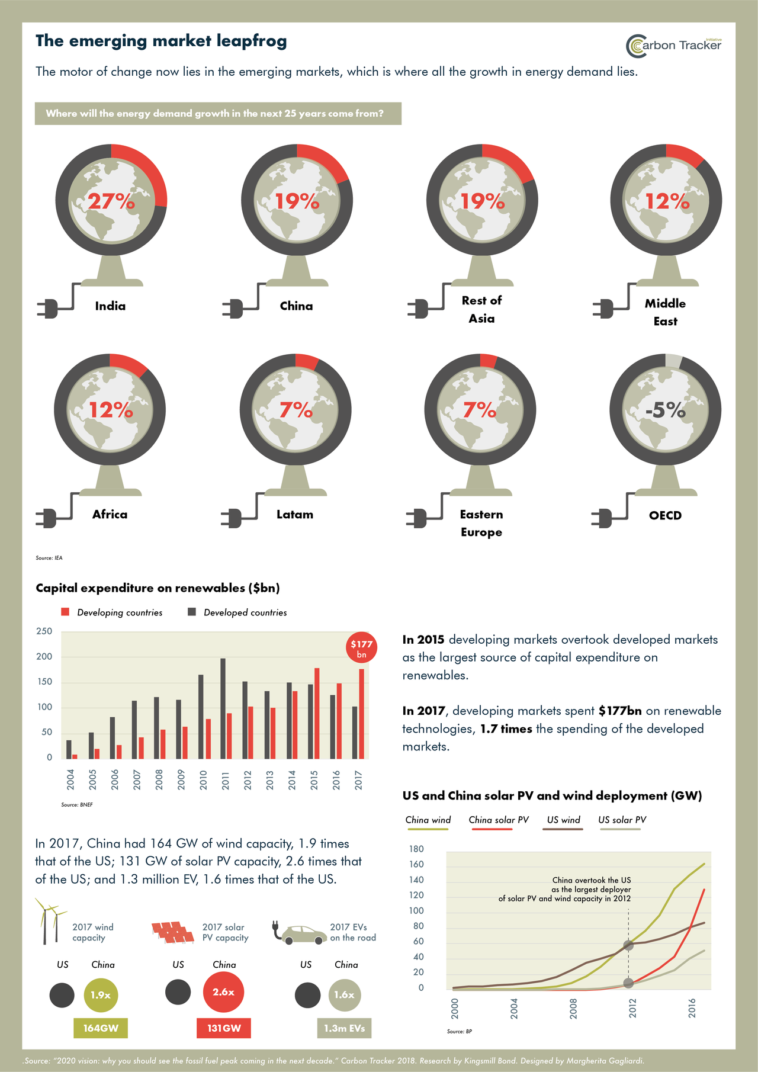
This is a series of five infographics produced to accompany the Carbon Tracker report “2020 Vision” (Sep 2018). They identify the key drivers od the energy transition, analysis the fall in price for renewables and the role of emerging markets. Finally the warn investors about the financial risks capital markets investing in fossil fuels will face in the next decade. The graphics are also included in this video animation.