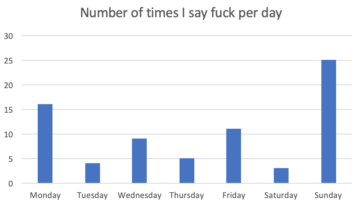
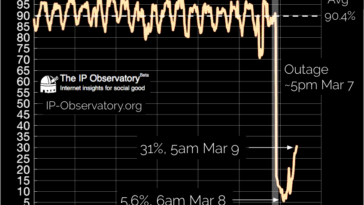
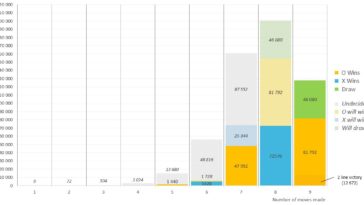
in Infographics data visualization : [OC] Number of times I say fuck per day, over a week. And yes, I am dying in university.
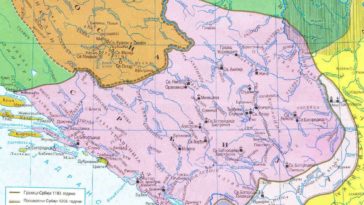
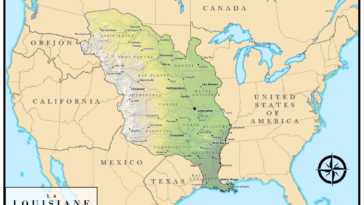
in Map Map : To anyone who enjoyed the Battle of France animation: I highly suggest Eastory’s animation of the Eastern Front on Youtube! Link in Comments!
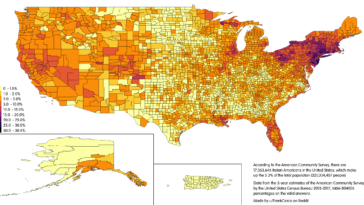
in Infographics data visualization : Italian Americans by county, 2013-2017 American Community Survey [OC]